

Question: 13. Statistics for three stocks, A, B, and C, are shown in the following tables. Standard Deviation of Returns Stock A B C Standard deviation
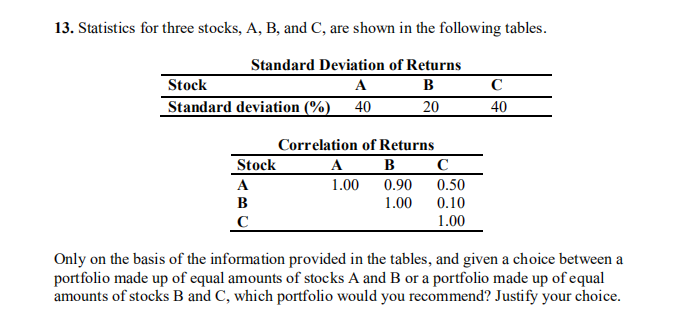

13. Statistics for three stocks, A, B, and C, are shown in the following tables. Standard Deviation of Returns Stock A B C Standard deviation (%) 40 20 40 Correlation of Returns Stock A B C A 1.00 0.90 0.50 B 1.00 0.10 C 1.00 Only on the basis of the information provided in the tables, and given a choice between a portfolio made up of equal amounts of stocks A and B or a portfolio made up of equal amounts of stocks B and C, which portfolio would you recommend? Justify your choice
Step by Step Solution
There are 3 Steps involved in it
1 Expert Approved Answer
Step: 1 Unlock

Question Has Been Solved by an Expert!
Get step-by-step solutions from verified subject matter experts
Step: 2 Unlock
Step: 3 Unlock