

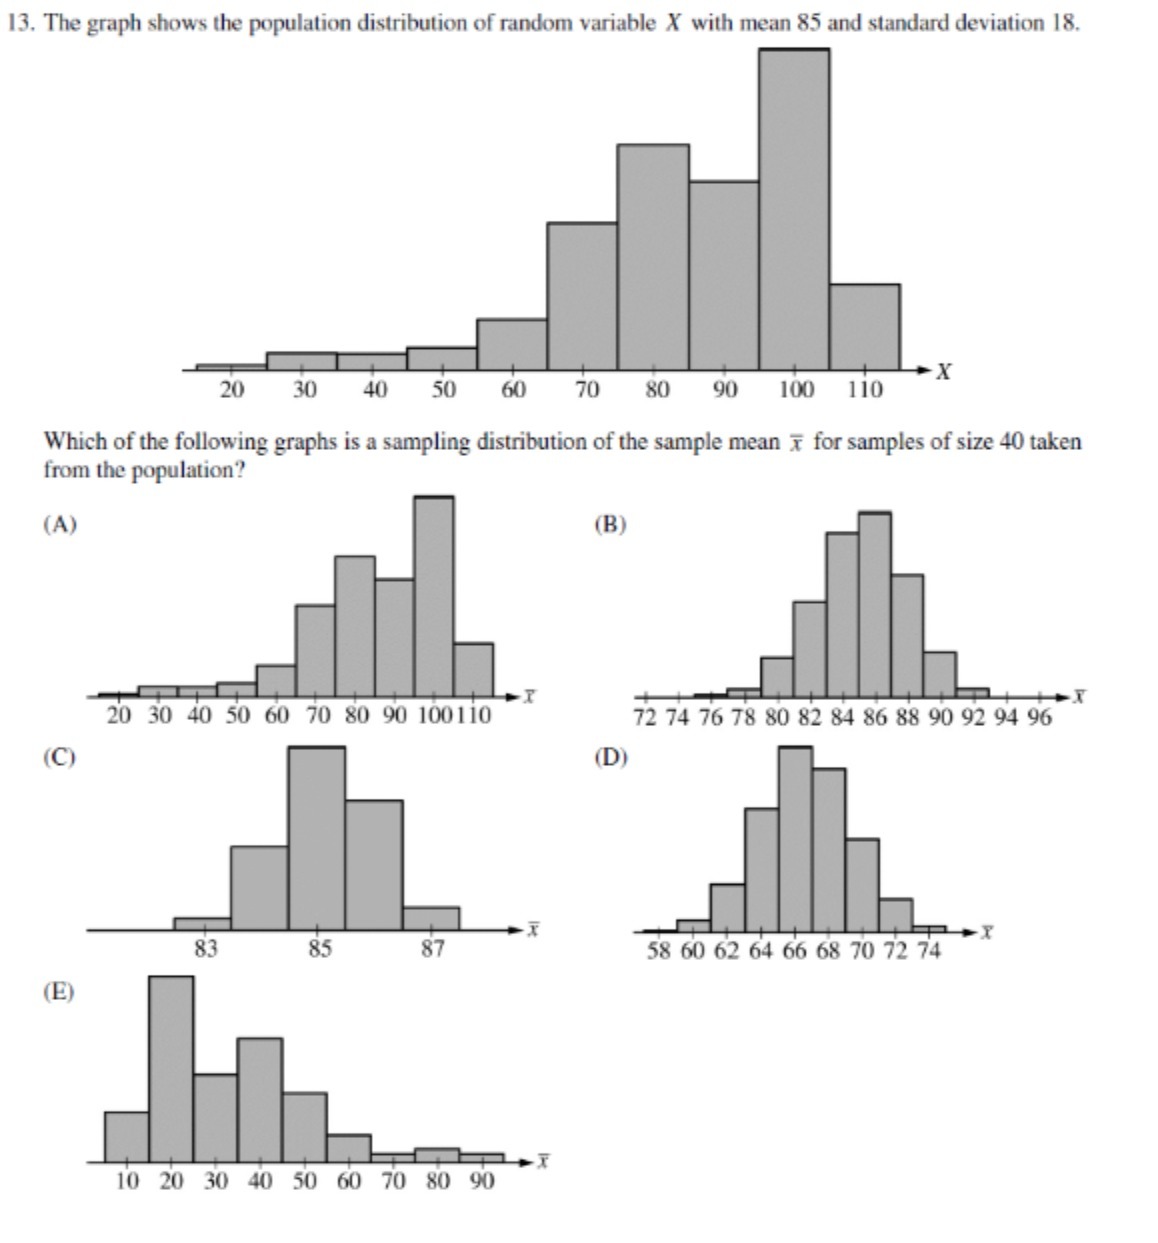
Question: 13. The graph shows the population distribution of random variable X with mean 85 and standard deviation 18. 20 30 40 50 60 70 80
Step by Step Solution
There are 3 Steps involved in it
1 Expert Approved Answer
Step: 1 Unlock

Question Has Been Solved by an Expert!
Get step-by-step solutions from verified subject matter experts
Step: 2 Unlock
Step: 3 Unlock