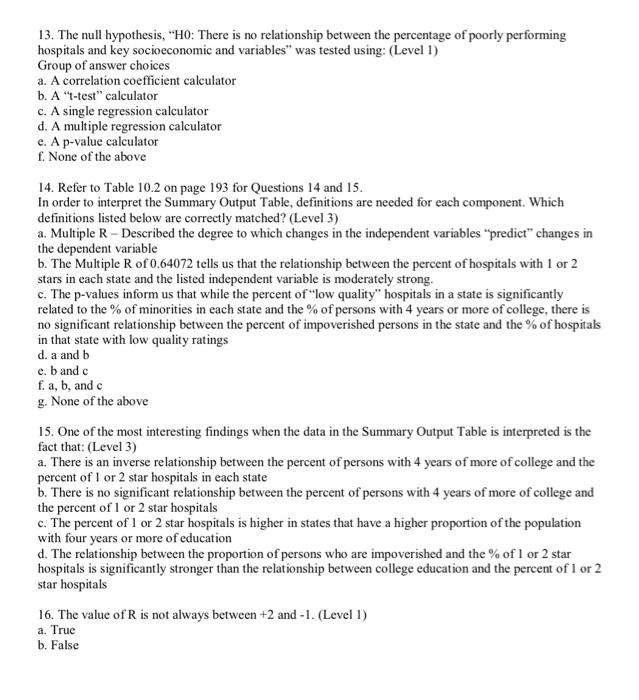
Question: 13. The null hypothesis, HO: There is no relationship between the percentage of poorly performing hospitals and key socioeconomic and variables was tested using: (Level

13. The null hypothesis, "HO: There is no
13. The null hypothesis, "HO: There is no relationship between the percentage of poorly performing hospitals and key socioeconomic and variables" was tested using: (Level 1) Group of answer choices a. A correlation coefficient calculator b. A "t-test" calculator c. A single regression calculator d. A multiple regression calculator e. A p-value calculator f. None of the above 14. Refer to Table 10.2 on page 193 for Questions 14 and 15. In order to interpret the Summary Output Table, definitions are needed for each component. Which definitions listed below are correctly matched? (Level 3) a. Multiple R-Described the degree to which changes in the independent variables "predict" changes in the dependent variable b. The Multiple R of 0.64072 tells us that the relationship between the percent of hospitals with 1 or 2 stars in each state and the listed independent variable is moderately strong. c. The p-values inform us that while the percent of "low quality hospitals in a state is significantly related to the % of minorities in each state and the % of persons with 4 years or more of college, there is no significant relationship between the percent of impoverished persons in the state and the % of hospitals in that state with low quality ratings d. a and b e.bandc f. a, b, and c g. None of the above 15. One of the most interesting findings when the data in the Summary Output Table is interpreted is the fact that: (Level 3) a. There is an inverse relationship between the percent of persons with 4 years of more of college and the percent of 1 or 2 star hospitals in each state b. There is no significant relationship between the percent of persons with 4 years of more of college and the percent of 1 or 2 star hospitals c. The percent of 1 or 2 star hospitals is higher in states that have a higher proportion of the population with four years or more of education d. The relationship between the proportion of persons who are impoverished and the % of 1 or 2 star hospitals is significantly stronger than the relationship between college education and the percent of 1 or 2 star hospitals 16. The value of R is not always between +2 and - 1. (Level 1) a. True b. False

Step by Step Solution

There are 3 Steps involved in it

1 Expert Approved Answer
Step: 1 Unlock blur-text-image
Question Has Been Solved by an Expert!

Get step-by-step solutions from verified subject matter experts

Step: 2 Unlock
Step: 3 Unlock

Students Have Also Explored These Related General Management Questions!