

Question: 13.1 Excel Activity 1 - ANOVA (Structured) 13.1 Excel Activity 1 - ANOVA (Structured) See attached for data A manufacturing company has been selected to


13.1 Excel Activity 1 - ANOVA (Structured)
13.1 Excel Activity 1 - ANOVA (Structured)
See attached for data
A manufacturing company has been selected to assemble a small but important component that will be used during the construction of numerous infrastructure projects. The company anticipates the need to assemble several million components over the next several years. Company engineers select three potential assembly methods: Method A, Method B, and Method C. Management would like to select the method that produces the fewest number parts per 10,000 parts produced that do not meet specifications. It may also be possible that there is no statistical difference between the three methods in which case the lowest cost method will be selected for production. While all parts are checked before leaving the factory, the best method will reduce the number of parts that need to be recycled back into the production process.
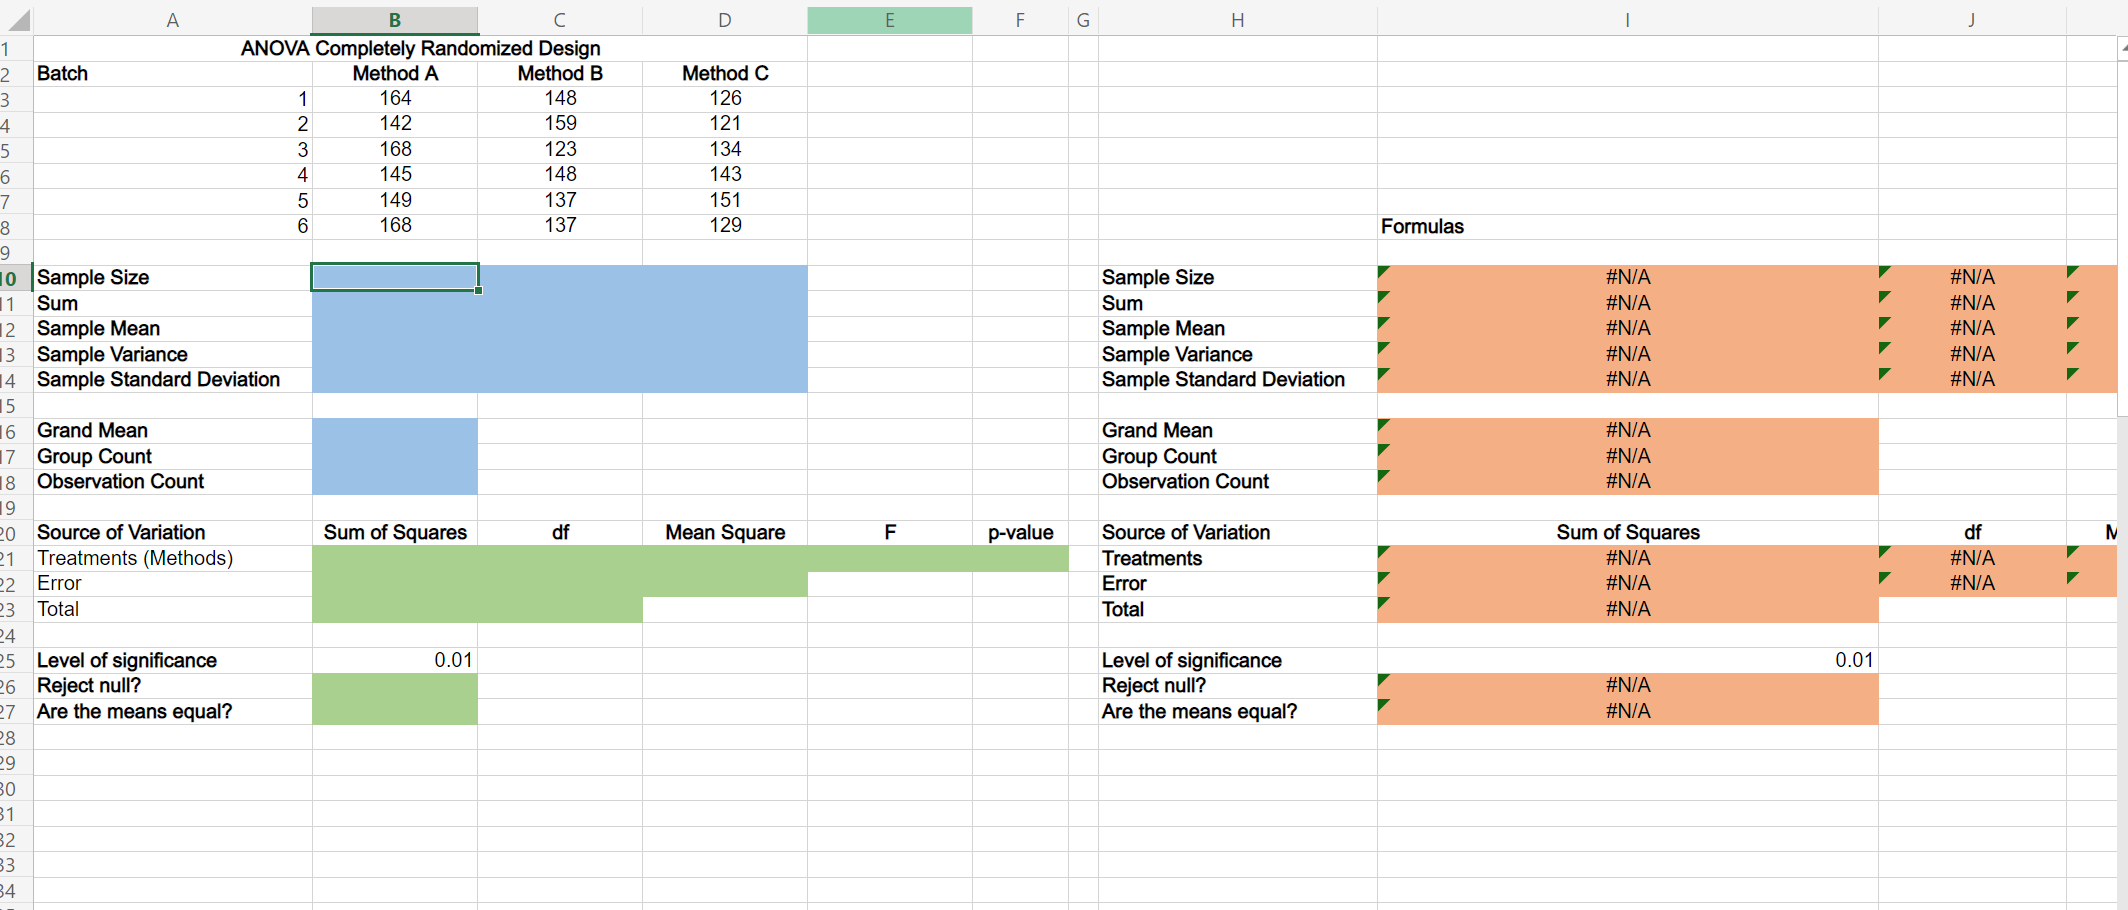
To test each method, six batches of 10,000 components are produced using each of the three methods. The number of components out of specification are recorded in the Microsoft Excel Online file below. Analyze the data to determine if there is any difference in the mean number of components that are out of specificaion among the three methods. After conducting the analysis report the findings to the management team.
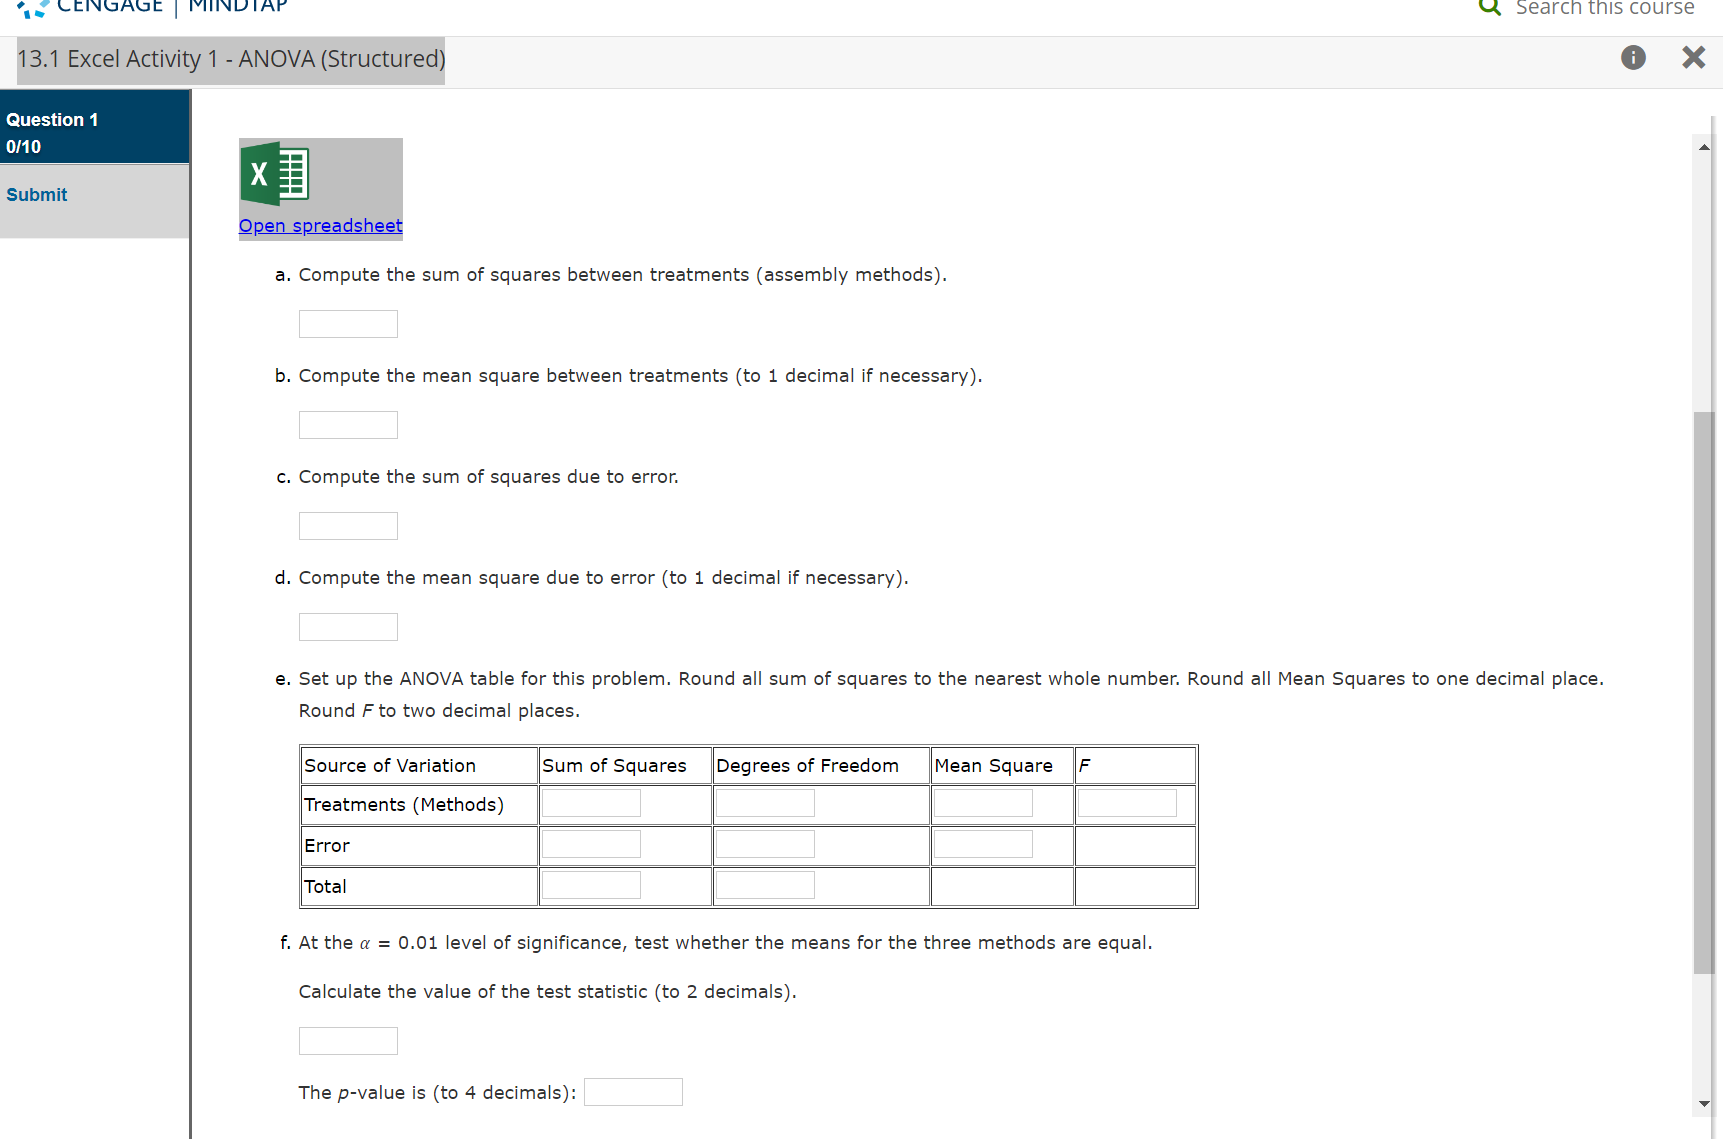

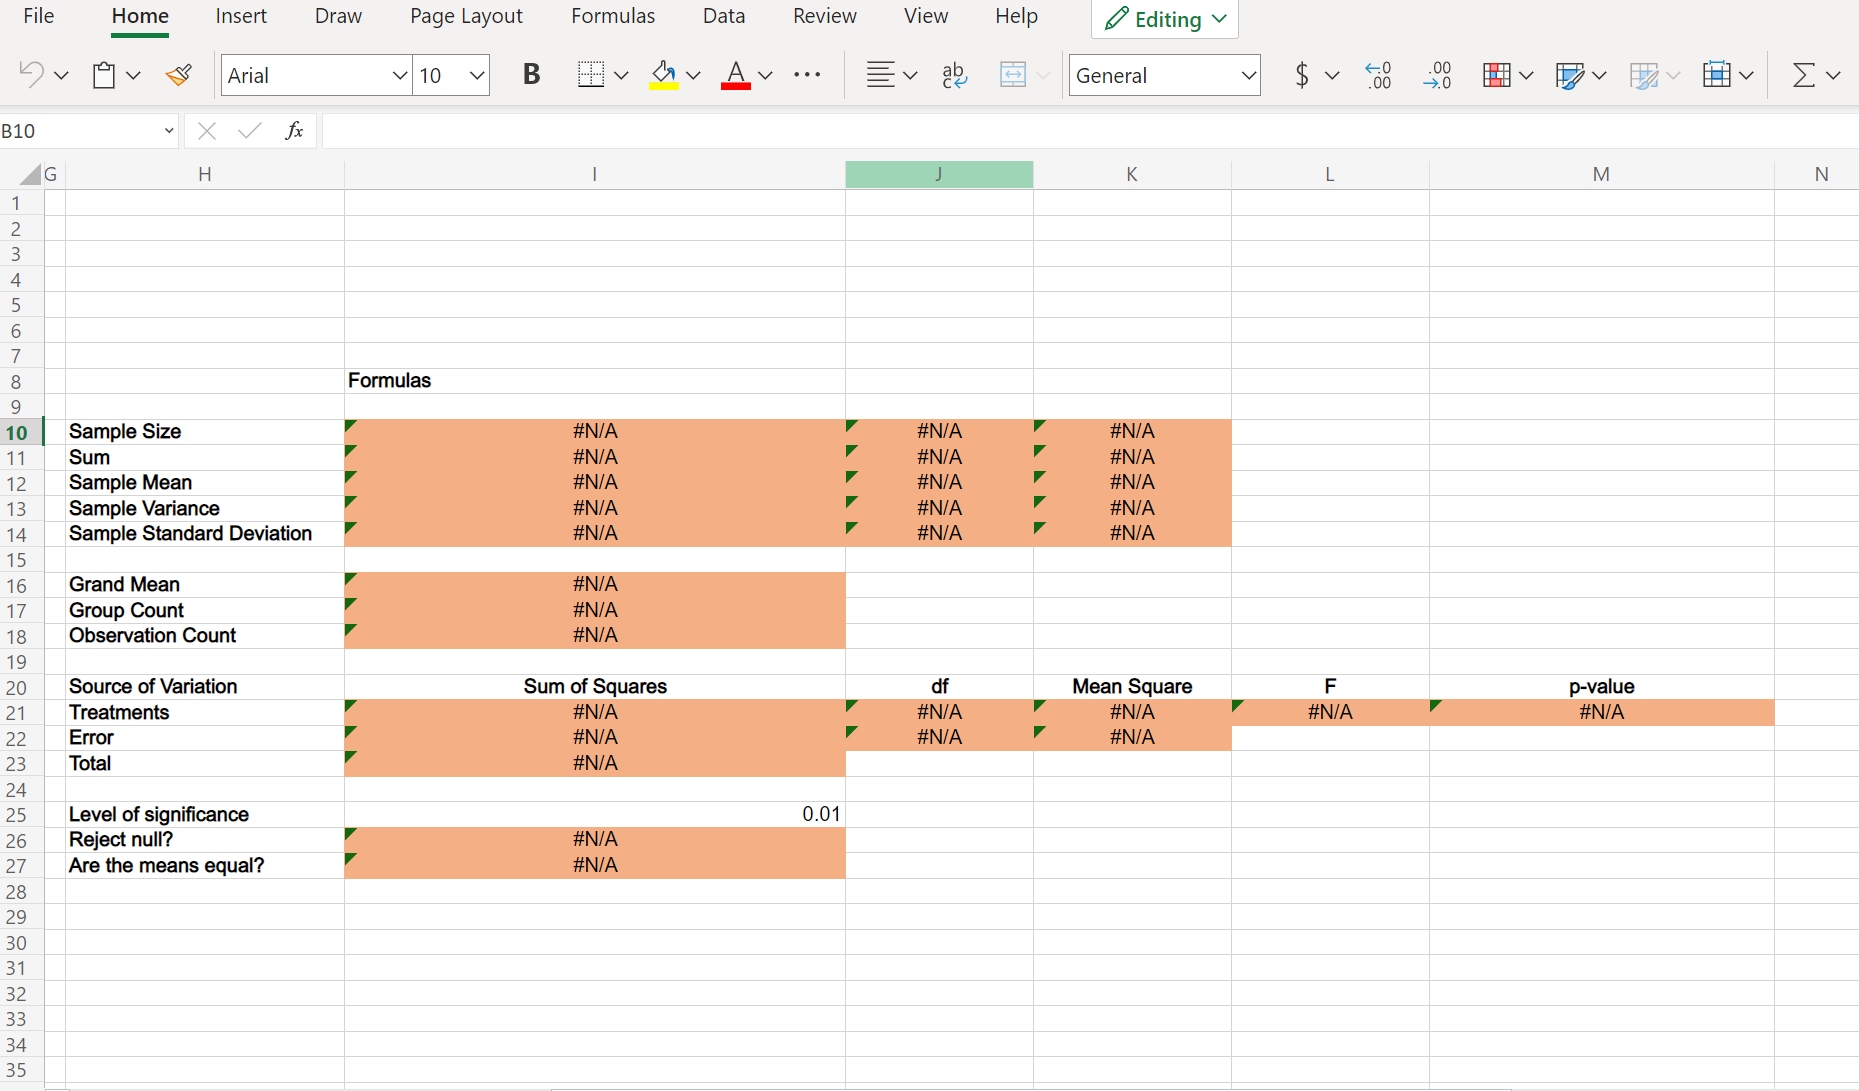
'l: LthlJI-\"Jt | IVIINLJIAI" Ml Search this course ox Question 1 0110 A Submit X E a. Compute the sum of squares between treatments (assembly methods). b. Compute the mean square between treatments (to 1 decimal if necessary). c. Compute the sum of squares due to error. d. Compute the mean square due to error (to 1 decimal if necessary). e. Set up the ANOVA table for this problem. Round all sum of squares to the nearest whole number. Round all Mean Squares to one decimal place. Round Fto two decimal places. Source of Variation Sum of Squares Degrees of Freedom Mean Square F Treatments (Methods) Error Tota l f. At the a- = 0.01 level of signicance, test whether the means for the three methods are equal. Calculate the value of the test statistic {to 2 decimals). The p-value is (to 4 decimals):
Step by Step Solution
There are 3 Steps involved in it

Get step-by-step solutions from verified subject matter experts