

Question: 13k.The picture below shows output for a multiple linear regression used to predict house price in Gainesville. 1.Based of this output, we would use the
13k.The picture below shows output for a multiple linear regression used to predict house price in Gainesville.
1.Based of this output, we would use the R-squared, which is approximately equal to
A.) 24.72%
B.) 26.23%
2.We can also see that the standard deviation of the residuals is approximately equal to
A.) 228649.2
B.) 408565.3
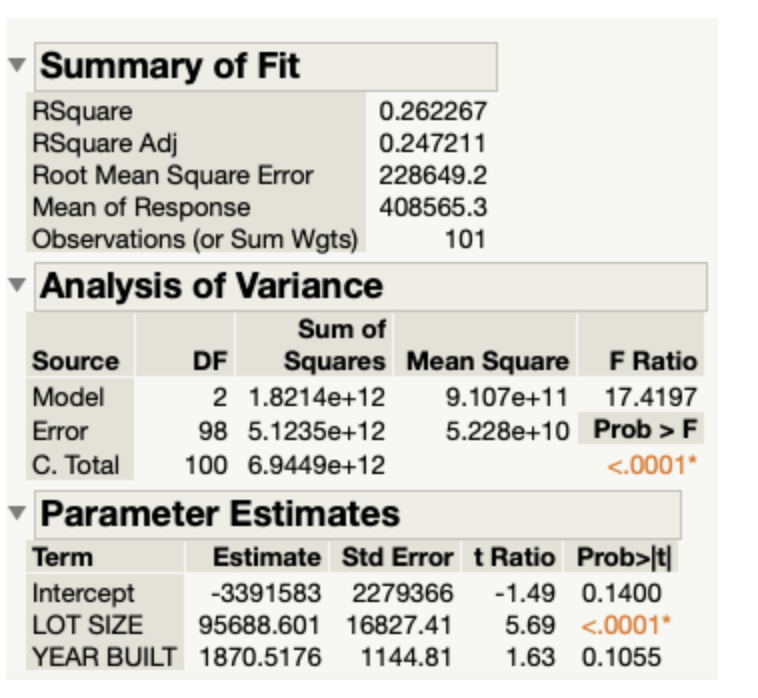
Summary of Fit RSquare 0.262267 RSquare Adj 0.247211 Root Mean Square Error 228649.2 Mean of Response 408565.3 Observations (or Sum Wgts) 101 Analysis of Variance Sum of Source DF Squares Mean Square F Ratio Model 2 1.8214e+12 9.107e+11 17.4197 Error 98 5.1235e+12 5.228e+10 Prob > F C. Total 100 6.9449e+12 <.0001 parameter estimates term estimate std error t ratio prob>|t] Intercept -3391583 2279366 -1.49 0.1400 LOT SIZE 95688.601 16827.41 5.69 <.0001 year built>
Step by Step Solution
There are 3 Steps involved in it

Get step-by-step solutions from verified subject matter experts