

Question: 14. The Table below shows output per capita in selected Asian countries, 1960 - 2019) in 2011 US Dollars). Discuss the reasons behind such impressive
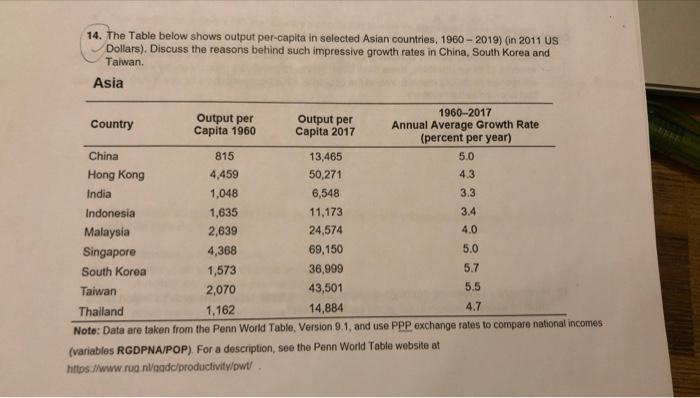
14. The Table below shows output per capita in selected Asian countries, 1960 - 2019) in 2011 US Dollars). Discuss the reasons behind such impressive growth rates in China, South Korea and Talwan. Asia Country Output per 1960-2017 Output per Capita 1960 Capita 2017 Annual Average Growth Rate (percent per year) China 815 13,465 5.0 Hong Kong 4,459 50,271 4.3 India 1,048 6,548 3.3 Indonesia 1,635 11,173 3.4 Malaysia 2,639 24,574 4.0 Singapore 4,368 69,150 5.0 South Korea 1,573 36,999 5.7 Taiwan 2,070 43,501 5.5 Thailand 1.162 14,884 4.7 Note: Data are taken from the Penn World Table, Version 9.1, and use PPP exchange rates to compare national incomes (variables RGDPNA/POP). For a description, so the Penn World Table website at https://www.ruangdo/productivity/pwt
Step by Step Solution
There are 3 Steps involved in it

Get step-by-step solutions from verified subject matter experts