Question: 14. (total 25 points) Consider the data set which involves stock data for 19 companies. the variables are profit margin (x1), growth rate (x2), type
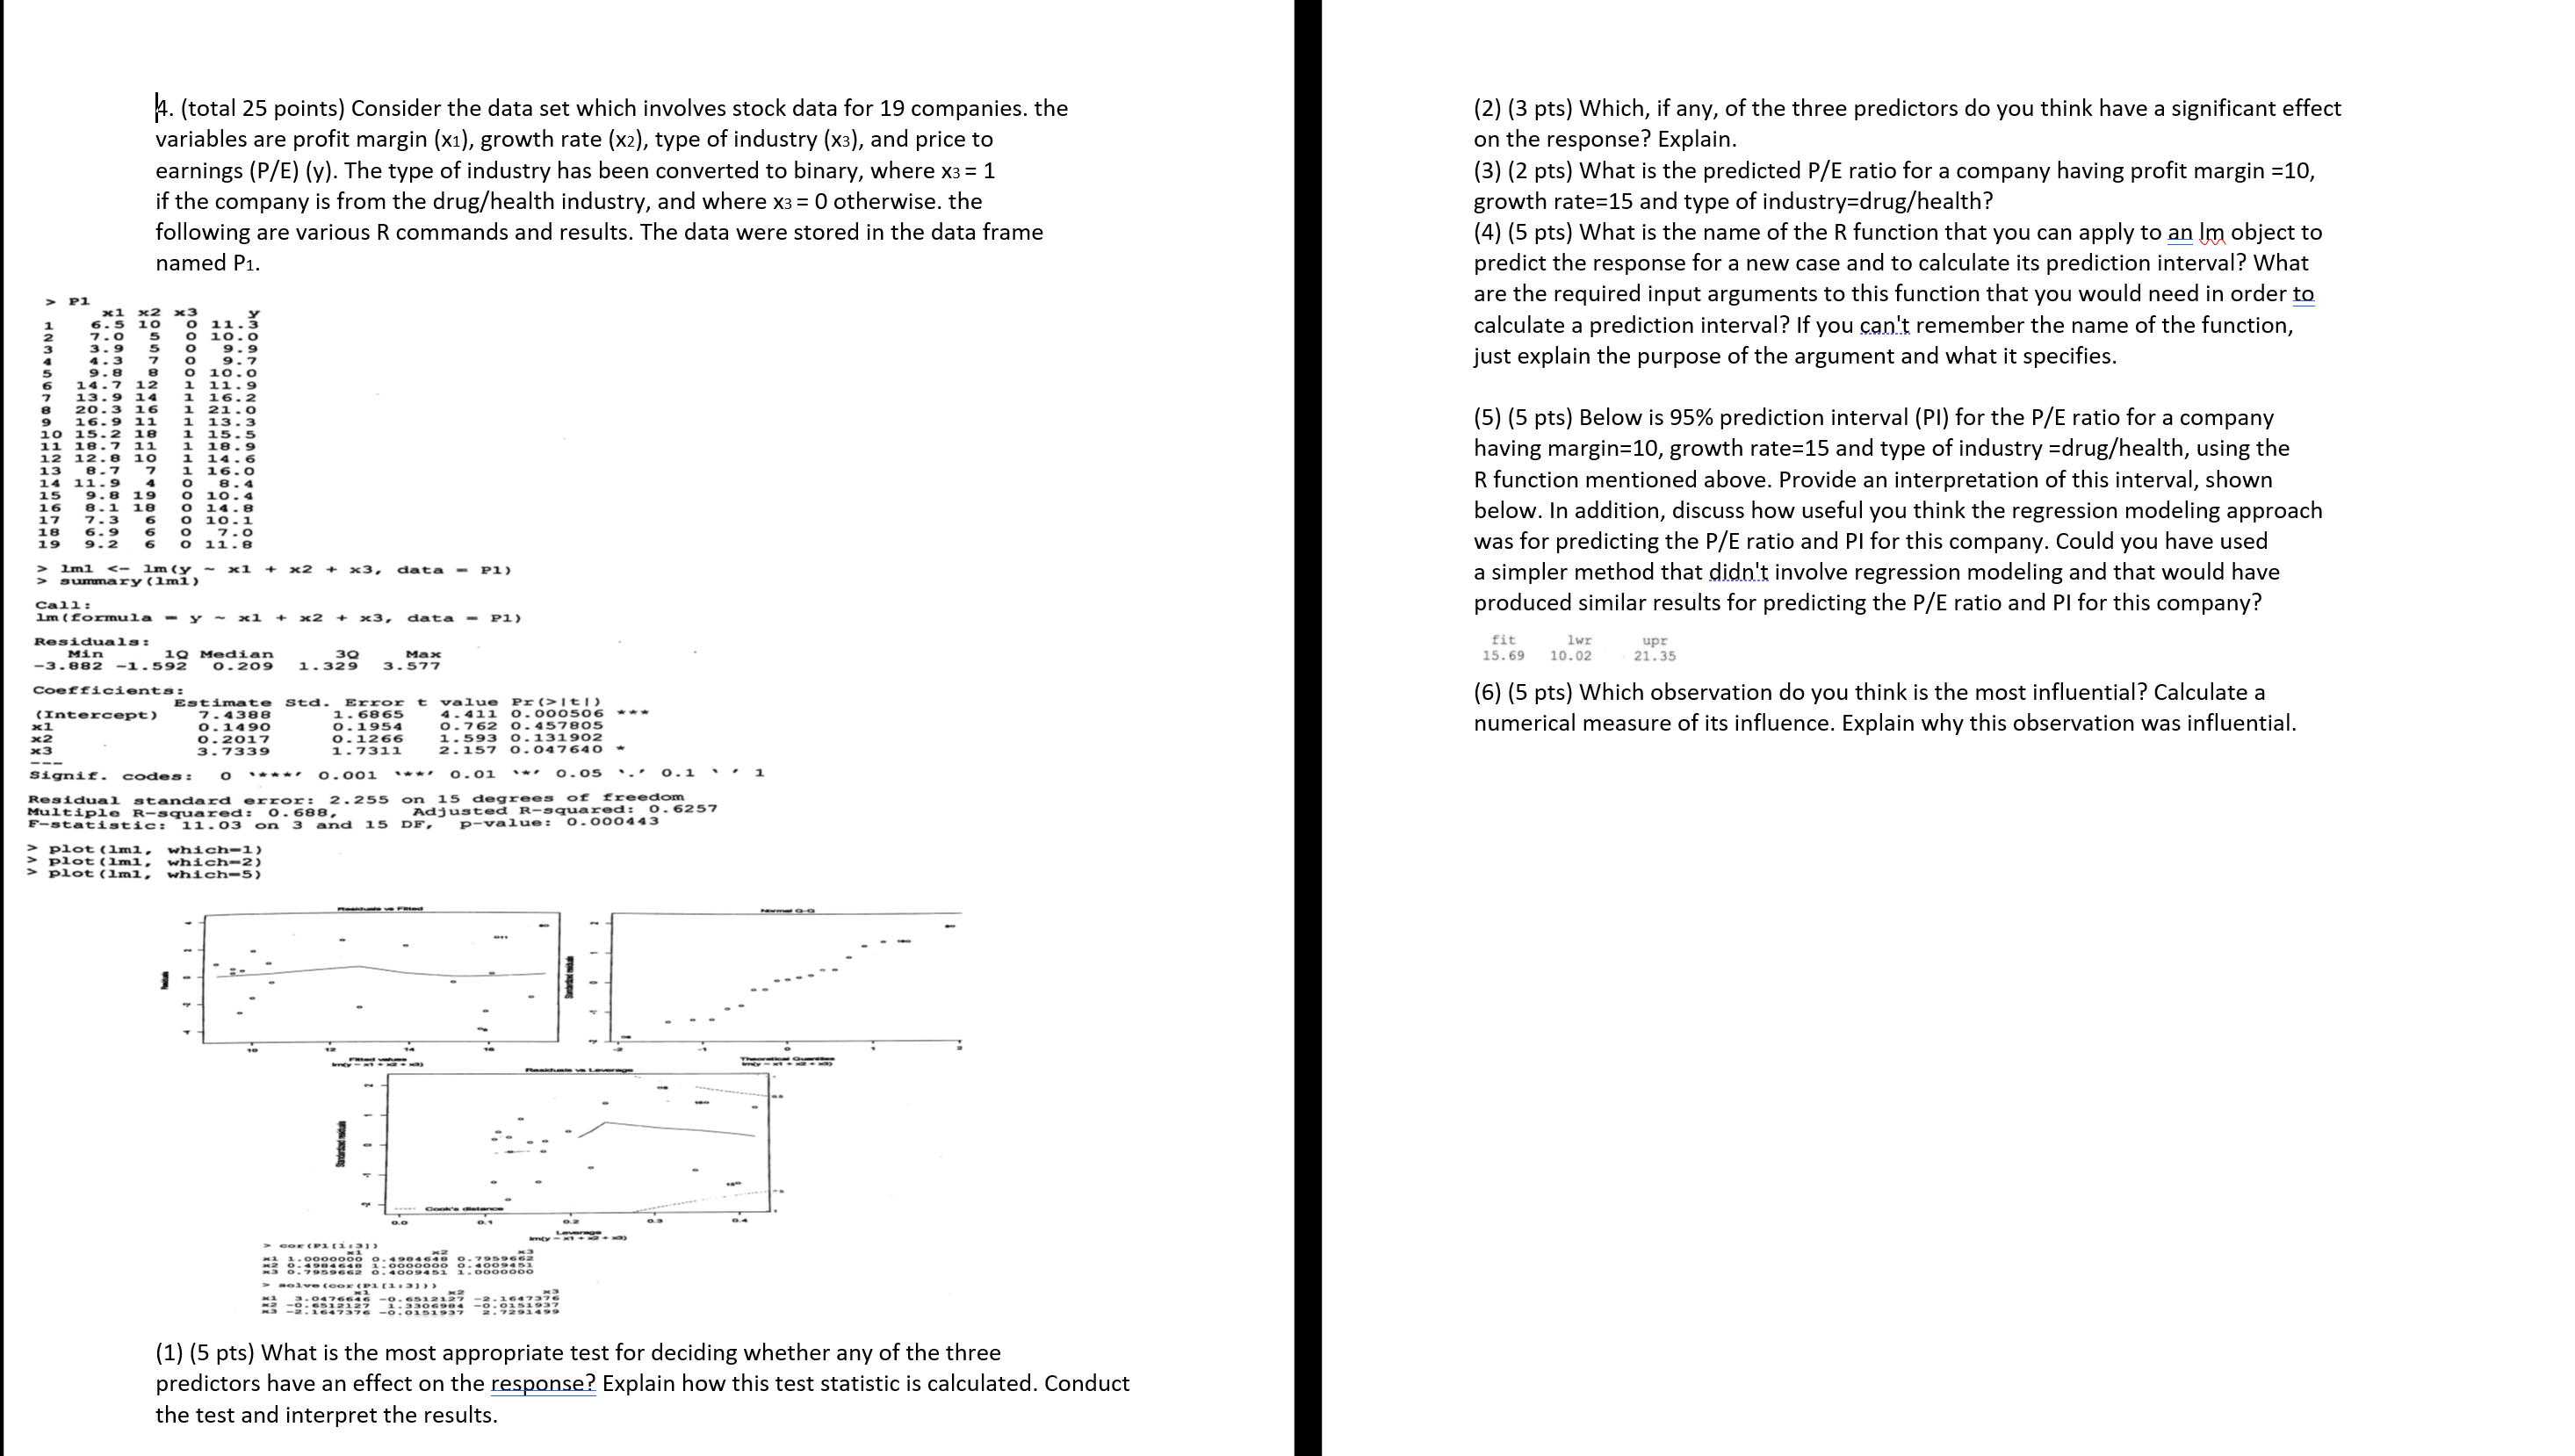
14. (total 25 points) Consider the data set which involves stock data for 19 companies. the variables are profit margin (x1), growth rate (x2), type of industry (x3), and price to earnings (P/E) (y). The type of industry has been converted to binary, where x3 = 1 if the company is from the drug/health industry, and where x3 = 0 otherwise, the following are various R commands and results. The data were stored in the data frame named P1. (2) (3 pts) Which, if any, of the three predictors do you think have a significant effect on the response? Explain. (3) (2 pts) What is the predicted P/E ratio for a company having profit margin =10, growth rate=15 and type of industry=drug/health? (4) (5 pts) What is the name of the R function that you can apply to an Im object to predict the response for a new case and to calculate its prediction interval? What are the required input arguments to this function that you would need in order to calculate a prediction interval? If you can't remember the name of the function, just explain the purpose of the argument and what it specifies. P1 noomne AA 10 11 12 13 14 15 16 17 18 19 20. 16. 15. 18. 12.8 10 8.7 7 11.9 9.8 19 8.1 18 7.3 6 6.9 9.2 1 14.6 1 16.0 o 8.4 (5) (5 pts) Below is 95% prediction interval (PI) for the P/E ratio for a company having margin=10, growth rate=15 and type of industry =drug/health, using the R function mentioned above. Provide an interpretation of this interval, shown below. In addition, discuss how useful you think the regression modeling approach was for predicting the P/E ratio and Pl for this company. Could you have used a simpler method that didn't involve regression modeling and that would have produced similar results for predicting the P/E ratio and Pl for this company? x 1 + x2 Iml lm (y summary (lmi) + x3, data Pi) Call: lm (formula - y x1 + x2 + x3, data P1) Residuals: Min 19 Median -3.882 -1.592 0.209 fit 15.69 lwr 10.02 30 1.329 Max 3.577 upr 21.35 Coefficients: Estimate (Intercept) 7.4388 x1 0.1490 x2 0.2017 3 3.7339 Std. Error 1.6865 0.1954 0.1266 1.7311 t value Pr (>It!) 4.411 0.000506 0.762 0.457805 1.593 0.131902 2.157 0.047640 (6) (5 pts) Which observation do you think is the most influential? Calculate a numerical measure of its influence. Explain why this observation was influential. Signif. codes: o 0.001 0.01 0.05 ..' 0.1 .. 1 Residual standard error: 2.255 on 15 degrees of freedom Multiple R-squared: 0.688, Adjusted R-squared: 0.6257 F-statistic: 11.03 on 3 and 15 DE, p-value: 0.000443 > plot (lml, which-1) > plot (lml, which-2) > plot (lml, which-5) -- i 1 CON LOS 1 GOE ( Pt.3) (1) (5 pts) What is the most appropriate test for deciding whether any of the three predictors have an effect on the response? Explain how this test statistic is calculated. Conduct the test and interpret the results. 14. (total 25 points) Consider the data set which involves stock data for 19 companies. the variables are profit margin (x1), growth rate (x2), type of industry (x3), and price to earnings (P/E) (y). The type of industry has been converted to binary, where x3 = 1 if the company is from the drug/health industry, and where x3 = 0 otherwise, the following are various R commands and results. The data were stored in the data frame named P1. (2) (3 pts) Which, if any, of the three predictors do you think have a significant effect on the response? Explain. (3) (2 pts) What is the predicted P/E ratio for a company having profit margin =10, growth rate=15 and type of industry=drug/health? (4) (5 pts) What is the name of the R function that you can apply to an Im object to predict the response for a new case and to calculate its prediction interval? What are the required input arguments to this function that you would need in order to calculate a prediction interval? If you can't remember the name of the function, just explain the purpose of the argument and what it specifies. P1 noomne AA 10 11 12 13 14 15 16 17 18 19 20. 16. 15. 18. 12.8 10 8.7 7 11.9 9.8 19 8.1 18 7.3 6 6.9 9.2 1 14.6 1 16.0 o 8.4 (5) (5 pts) Below is 95% prediction interval (PI) for the P/E ratio for a company having margin=10, growth rate=15 and type of industry =drug/health, using the R function mentioned above. Provide an interpretation of this interval, shown below. In addition, discuss how useful you think the regression modeling approach was for predicting the P/E ratio and Pl for this company. Could you have used a simpler method that didn't involve regression modeling and that would have produced similar results for predicting the P/E ratio and Pl for this company? x 1 + x2 Iml lm (y summary (lmi) + x3, data Pi) Call: lm (formula - y x1 + x2 + x3, data P1) Residuals: Min 19 Median -3.882 -1.592 0.209 fit 15.69 lwr 10.02 30 1.329 Max 3.577 upr 21.35 Coefficients: Estimate (Intercept) 7.4388 x1 0.1490 x2 0.2017 3 3.7339 Std. Error 1.6865 0.1954 0.1266 1.7311 t value Pr (>It!) 4.411 0.000506 0.762 0.457805 1.593 0.131902 2.157 0.047640 (6) (5 pts) Which observation do you think is the most influential? Calculate a numerical measure of its influence. Explain why this observation was influential. Signif. codes: o 0.001 0.01 0.05 ..' 0.1 .. 1 Residual standard error: 2.255 on 15 degrees of freedom Multiple R-squared: 0.688, Adjusted R-squared: 0.6257 F-statistic: 11.03 on 3 and 15 DE, p-value: 0.000443 > plot (lml, which-1) > plot (lml, which-2) > plot (lml, which-5) -- i 1 CON LOS 1 GOE ( Pt.3) (1) (5 pts) What is the most appropriate test for deciding whether any of the three predictors have an effect on the response? Explain how this test statistic is calculated. Conduct the test and interpret the results


