

Question: 14. Use the information below to calculate the correlation between Gallons of Gas purchased in April 2011 and Avg price of gas in April 2011.
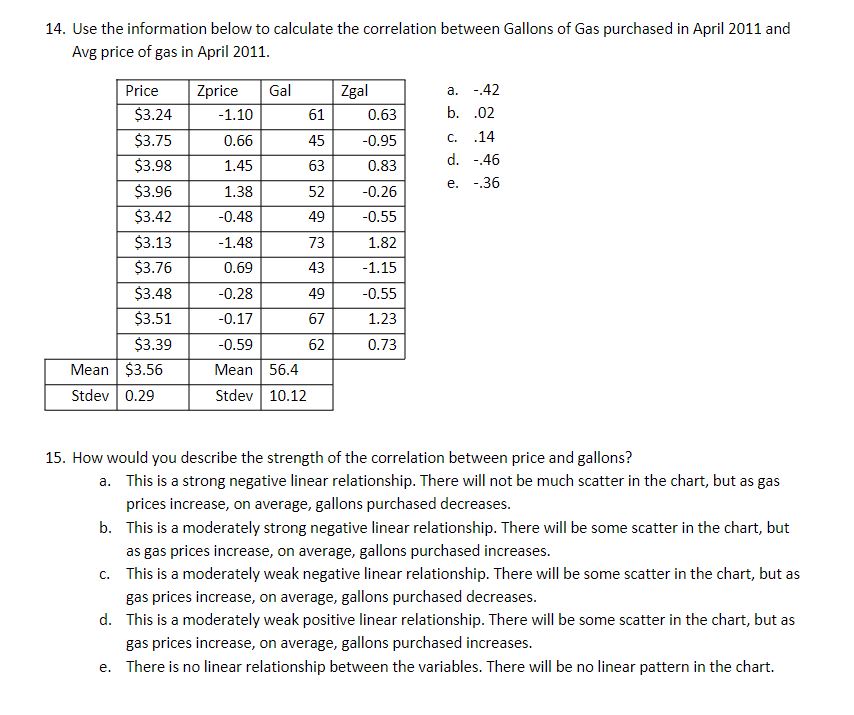
14. Use the information below to calculate the correlation between Gallons of Gas purchased in April 2011 and Avg price of gas in April 2011. Gal a. +12 $3.24 -1.10 61 {153 b. .02 $3.13 -1.4s 7'3 1.132 53.43 4123 49 -a.ss U1 M $3.56 Mean 56.4 Stdev 0.29 Stdev 10.12 15. How would you describe the strength of the correlation between price and gallons? a. This is a strong negative linear relationship. There will not be much scatter in the chart, but as gas prices increase, on average, gallons purchased decreases. b. This is a moderately strong negative linear relationship. There will be some scatter in the chart, but as gas prices increase, on average, gallons purchased increases. c. This is a moderately weal: negative linear relationship. There will be some scatter in the chart, but as gas prices increase, on average, gallons purchased decreases. d. This is a moderately weak positive linear relationship. There will be some scatter in the chart, but as gas prices increase, on average, gallons purchased increases. e. There is no linear relationship between the variables. There will be no linear pattern in the chart
Step by Step Solution
There are 3 Steps involved in it

Get step-by-step solutions from verified subject matter experts