

Question: 1=4%, Y=3,000 5. The graph below shows the Fed rule curve and the current equilibrium of an economy in which - P is fixed -
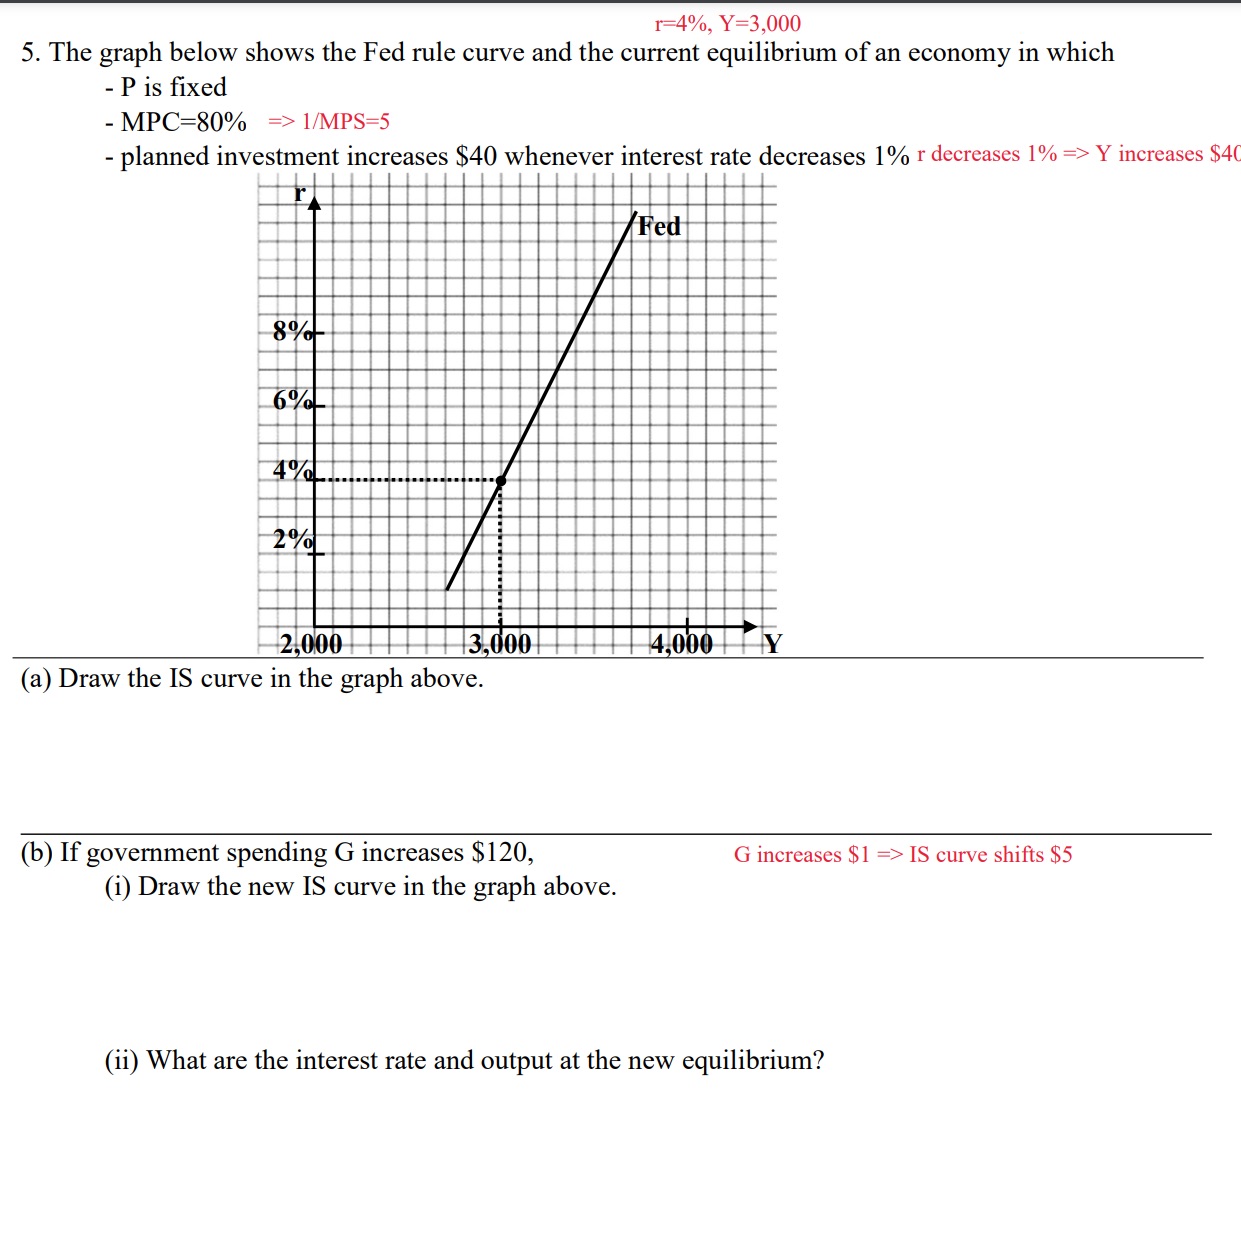
1=4%, Y=3,000 5. The graph below shows the Fed rule curve and the current equilibrium of an economy in which - P is fixed - MPC=80% => 1/MPS=5 - planned investment increases $40 whenever interest rate decreases 1% r decreases 1% => Y increases $4 /Fed 8% 6% 4% 2,000 3,000 4,000 Y (a) Draw the IS curve in the graph above. (b) If government spending G increases $120, G increases $1 => IS curve shifts $5 (i) Draw the new IS curve in the graph above. (ii) What are the interest rate and output at the new equilibrium
Step by Step Solution
There are 3 Steps involved in it
1 Expert Approved Answer
Step: 1 Unlock

Question Has Been Solved by an Expert!
Get step-by-step solutions from verified subject matter experts
Step: 2 Unlock
Step: 3 Unlock