

Question: 14-18. You are given the following sample data for variables x and y: X (independent) 1 7 3 8 11 5 4 y (dependent) 16
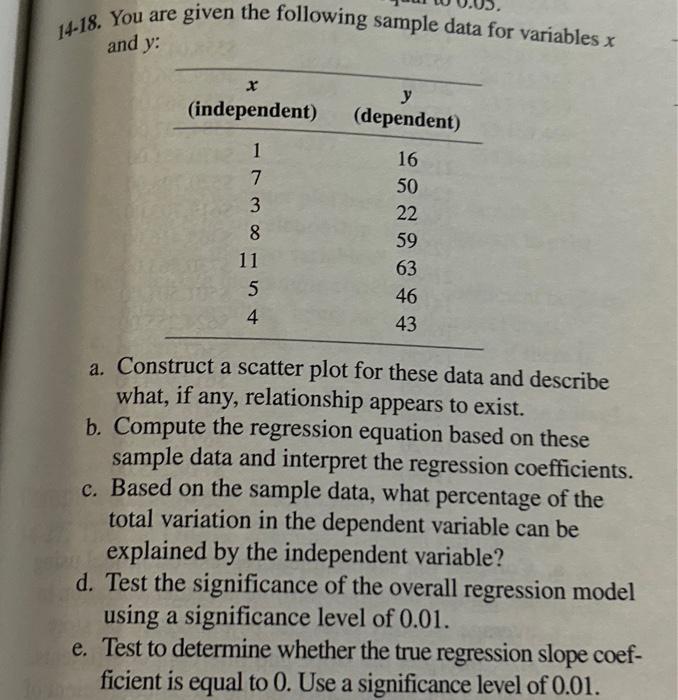
14-18. You are given the following sample data for variables x and y: X (independent) 1 7 3 8 11 5 4 y (dependent) 16 50 22 59 63 46 43 a. Construct a scatter plot for these data and describe what, if any, relationship appears to exist. b. Compute the regression equation based on these sample data and interpret the regression coefficients. c. Based on the sample data, what percentage of the total variation in the dependent variable can be explained by the independent variable? d. Test the significance of the overall regression model using a significance level of 0.01. e. Test to determine whether the true regression slope coef- ficient is equal to 0. Use a significance level of 0.01.
14-18. You are given the following sample data for variables x and y : a. Construct a scatter plot for these data and describe what, if any, relationship appears to exist. b. Compute the regression equation based on these sample data and interpret the regression coefficients. c. Based on the sample data, what percentage of the total variation in the dependent variable can be explained by the independent variable? d. Test the significance of the overall regression model using a significance level of 0.01 . e. Test to determine whether the true regression slope coefficient is equal to 0 . Use a significance level of 0.01
Step by Step Solution
There are 3 Steps involved in it
1 Expert Approved Answer
Step: 1 Unlock

Question Has Been Solved by an Expert!
Get step-by-step solutions from verified subject matter experts
Step: 2 Unlock
Step: 3 Unlock