

Question: 14.2 Excel Activity 1a - Scatter Diagram, Regression Equation, and Prediction (Structured) X Question 1 O 3.75/10 2 5 3.5 4.5 Submit Speed of Execution
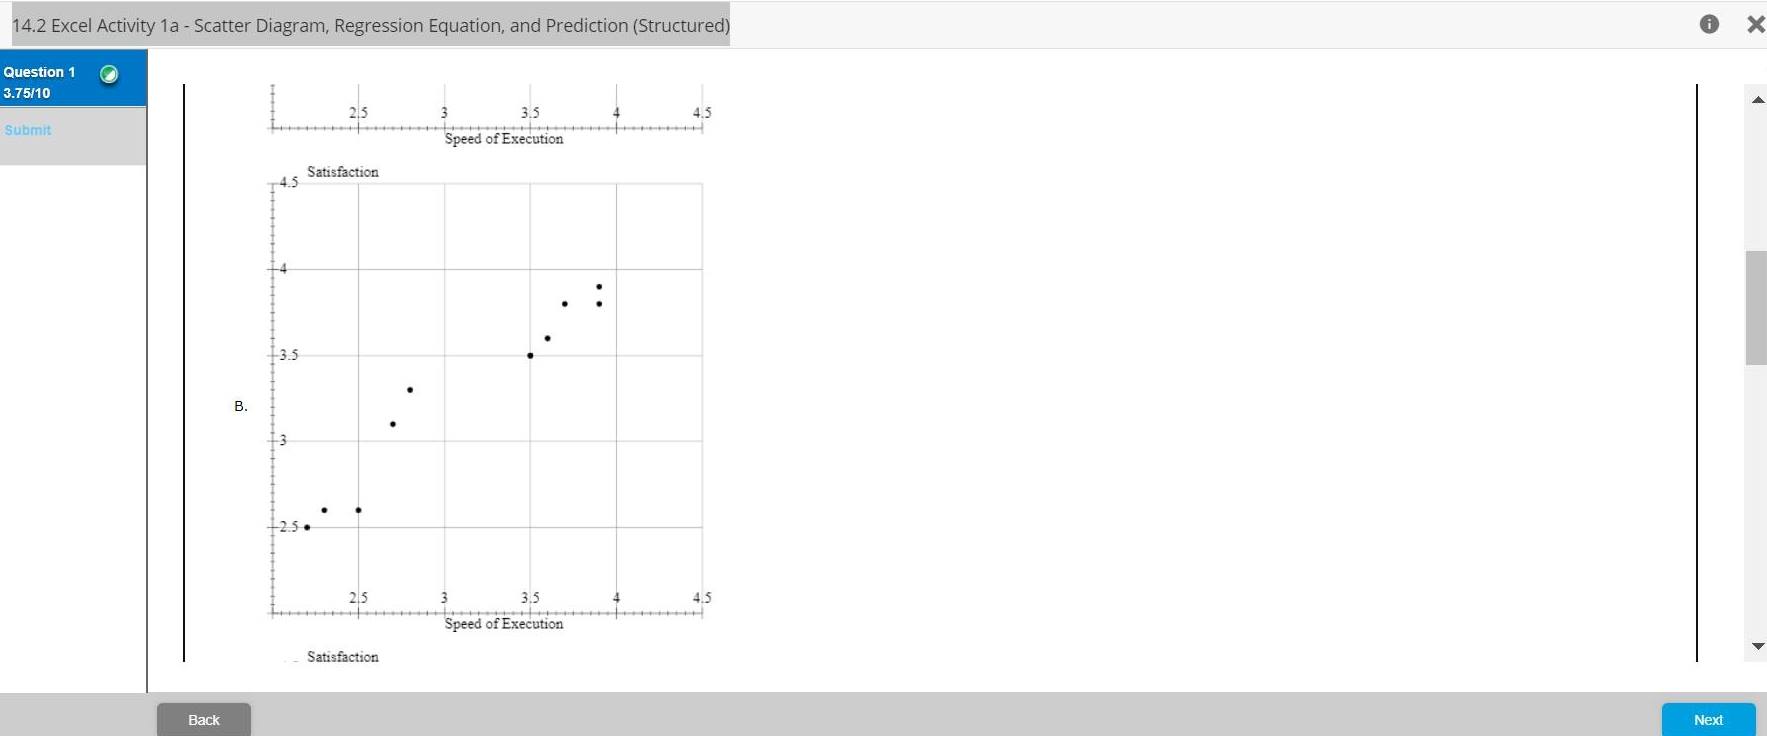
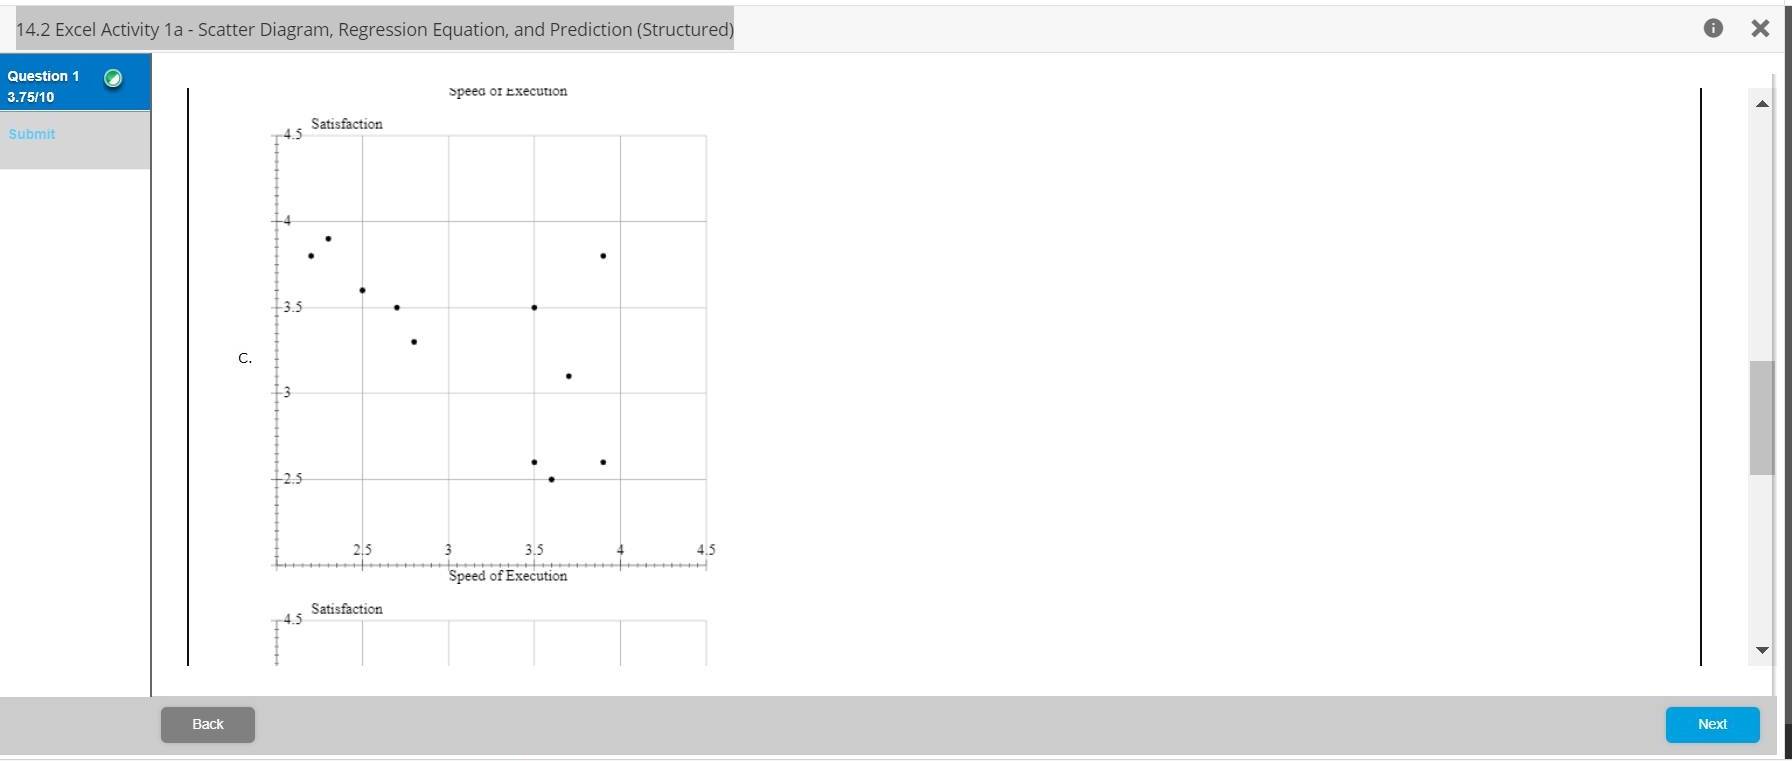
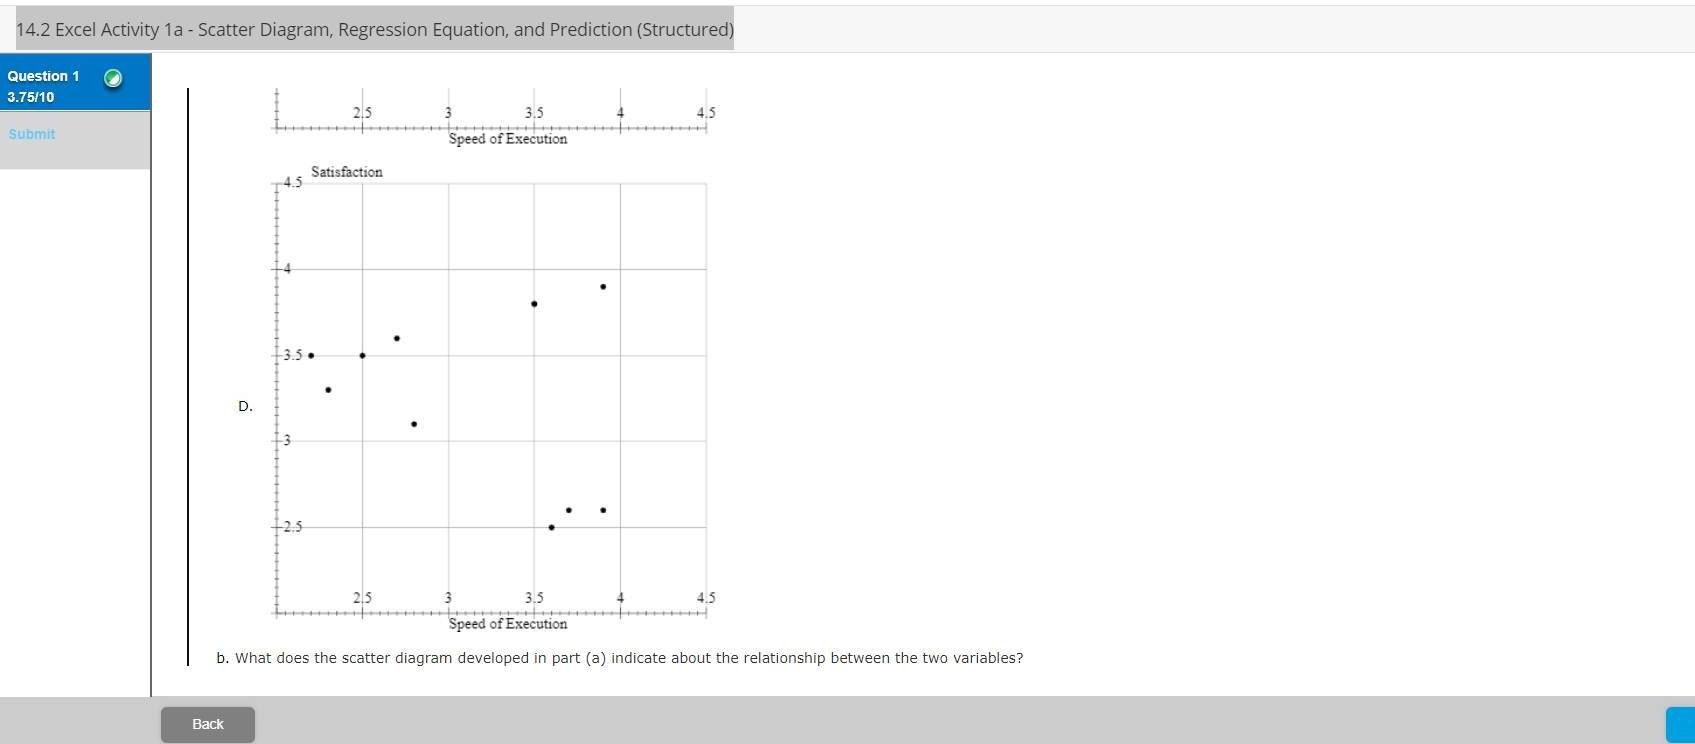
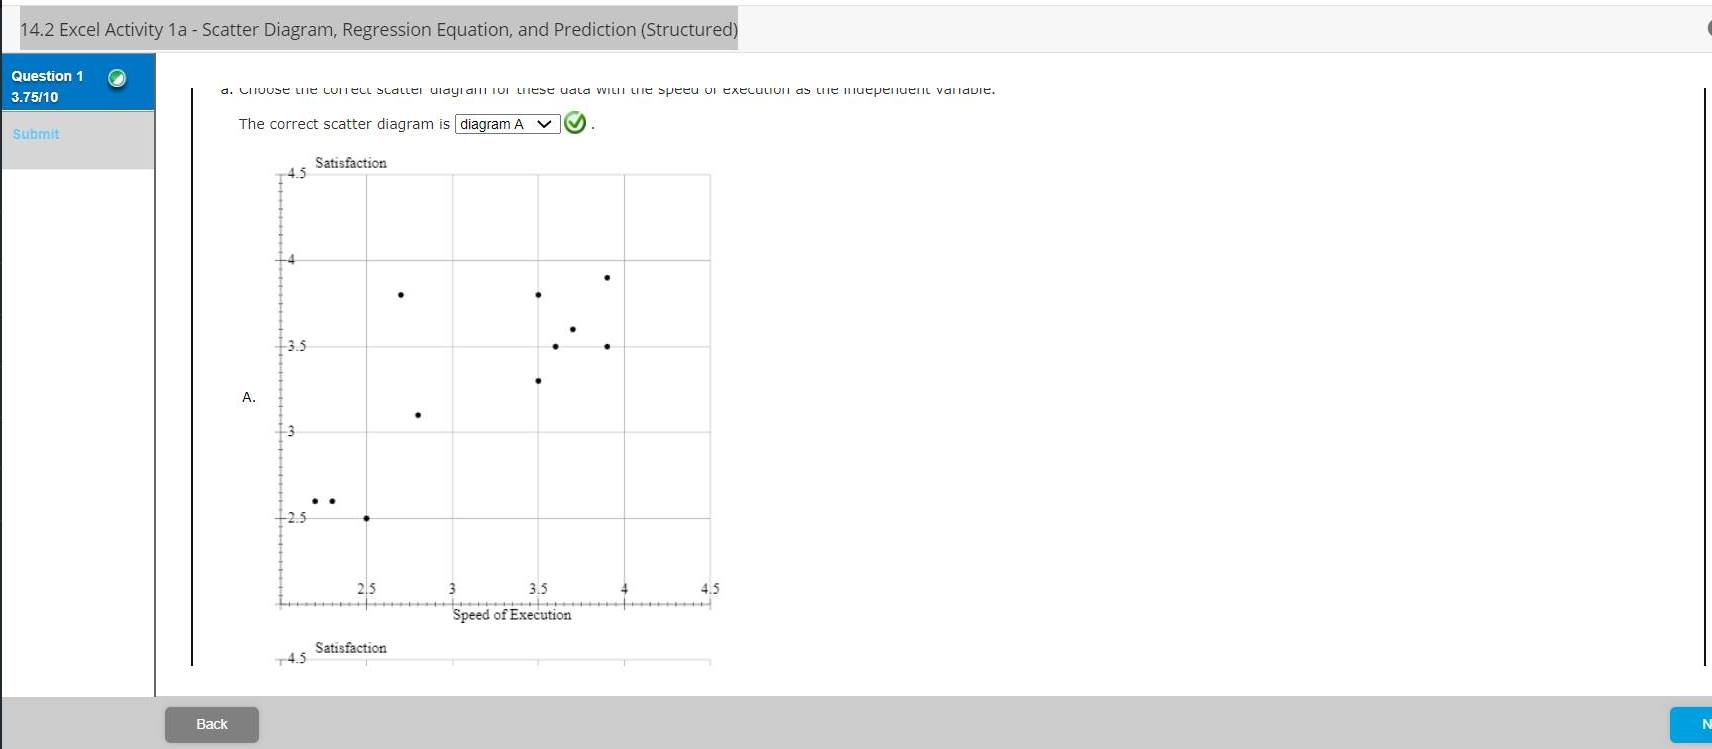
14.2 Excel Activity 1a - Scatter Diagram, Regression Equation, and Prediction (Structured) X Question 1 O 3.75/10 2 5 3.5 4.5 Submit Speed of Execution Satisfaction -4 -3.5 2 5 Speed of Execution Satisfaction Back Next\f14.2 Excel Activity 1a - Scatter Diagram, Regression Equation, and Prediction (Structured) Question 1 3.75/10 2 5 3 5 4.5 Submit Speed of Execution -45 Satisfaction 35. D. -3 215 3 3.5 4.5 Speed of Execution b. What does the scatter diagram developed in part (a) indicate about the relationship between the two variables? Back14.2 Excel Activity 1a - Scatter Diagram, Regression Equation, and Prediction (Structured) Question 1 3.75/10 a. CilUse LIE LITELL statLEI ulaylaill TOI test data WILLI the speed VI ExecuLUI as THE BluePEIVEIL ValidUIt. Submit The correct scatter diagram is |diagram A ]. 45 Satisfaction -3.5 A. 215 3.3 Speed of Execution 745 Satisfaction Back
Step by Step Solution
There are 3 Steps involved in it

Get step-by-step solutions from verified subject matter experts