

Question: 14.2 Excel Activity 1b - Scatter Diagram, Regression Equation, and Prediction (Freeform) Some association On-Line Discount Broker Survey polls members on their experiences with discount
14.2 Excel Activity 1b - Scatter Diagram, Regression Equation, and Prediction (Freeform)
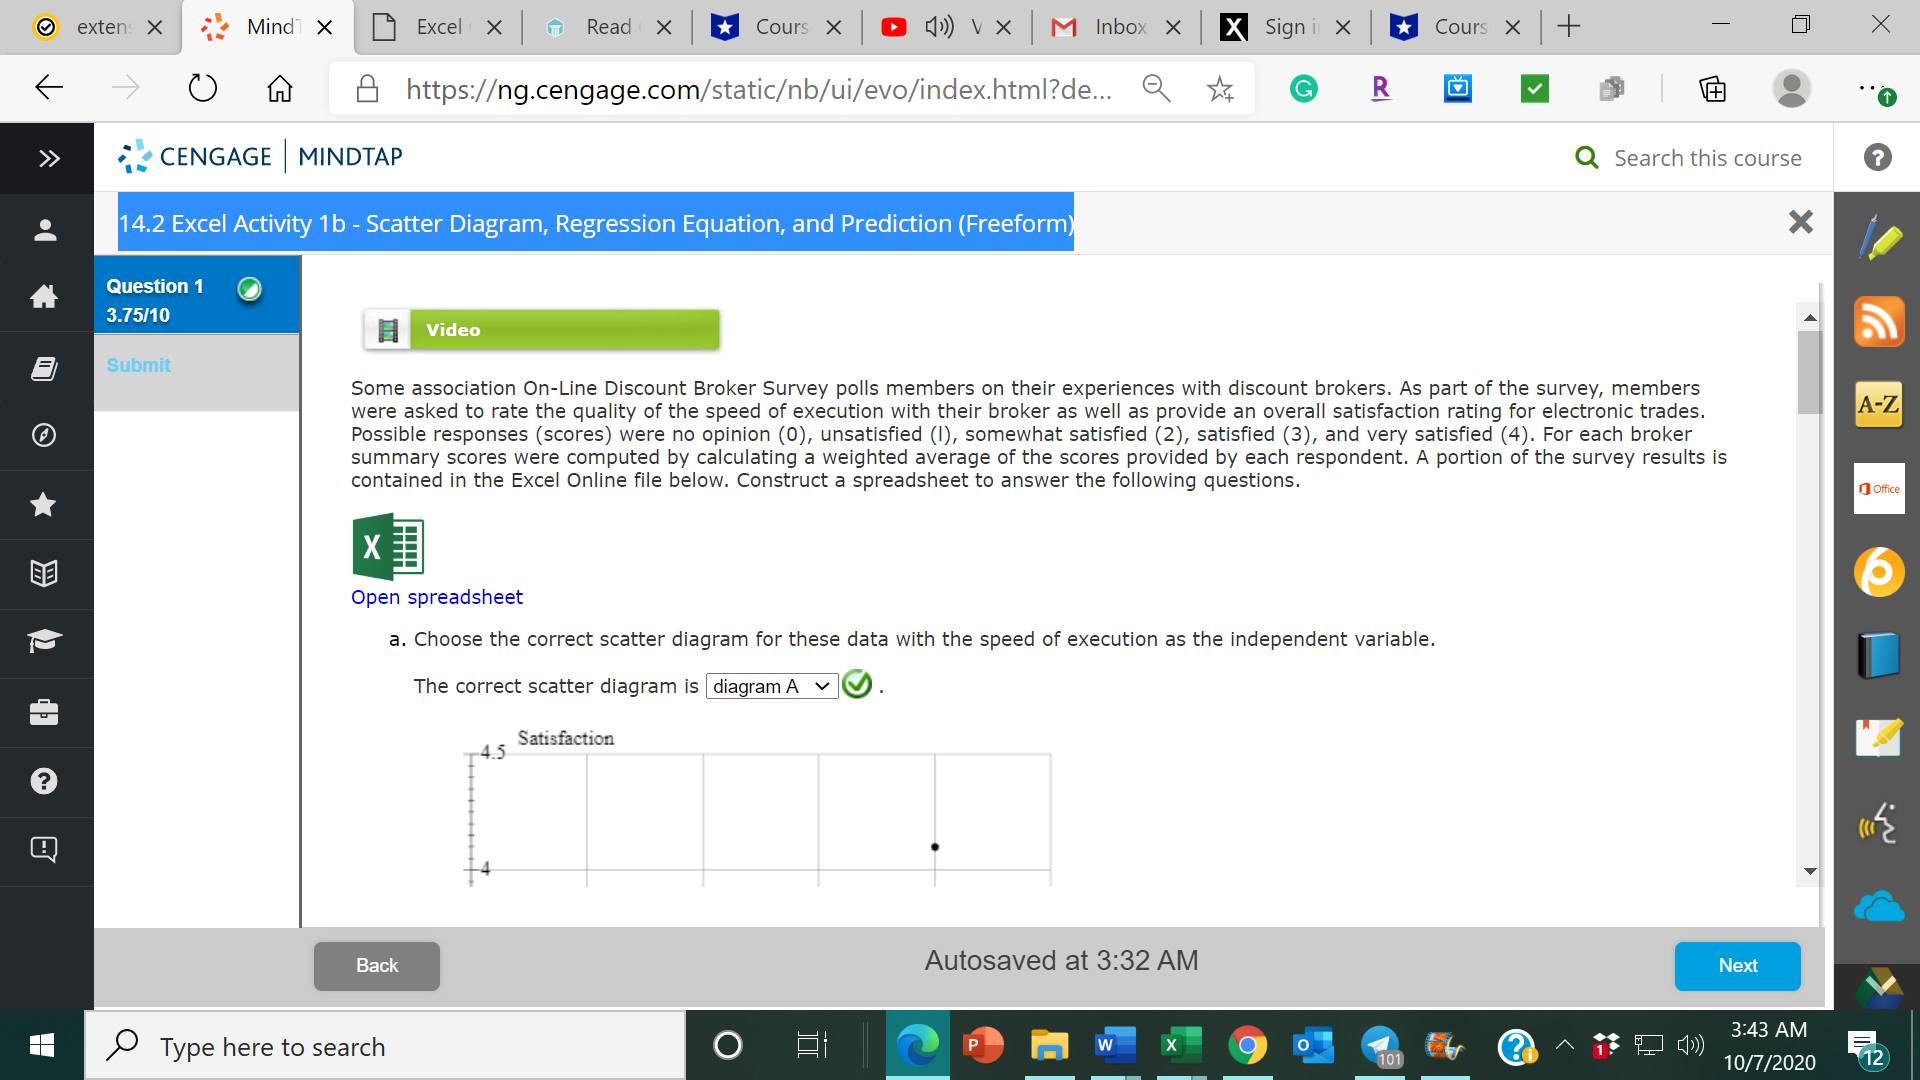
Some association On-Line Discount Broker Survey polls members on their experiences with discount brokers. As part of the survey, members were asked to rate the quality of the speed of execution with their broker as well as provide an overall satisfaction rating for electronic trades.
Possible responses (scores) were no opinion (0), unsatisfied (l), somewhat satisfied (2), satisfied (3), and very satisfied (4).
For each broker summary scores were computed by calculating a weighted average of the scores provided by each respondent. A portion of the survey results is contained in the Excel Online file below. Construct a spreadsheet to answer the following questions.
(SEE ATTACHED FOR MORE INFORMATION)
?
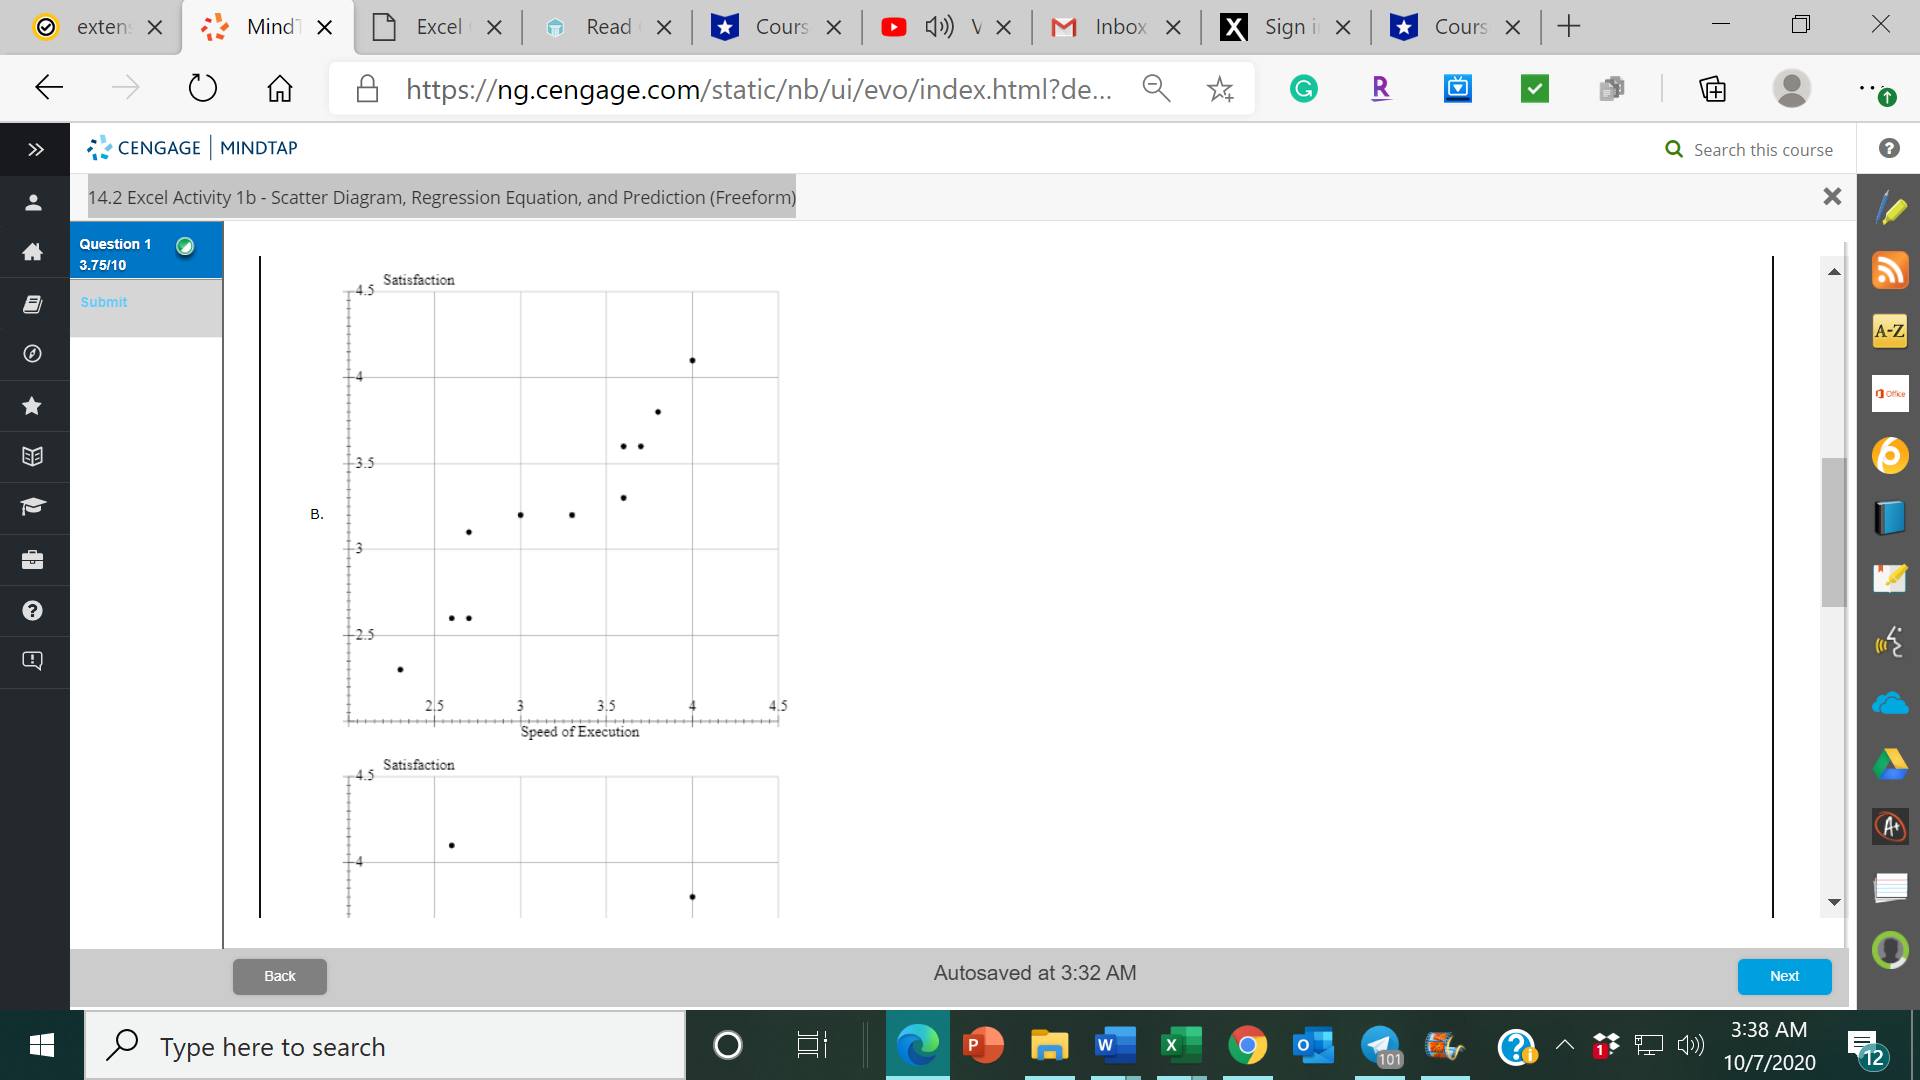
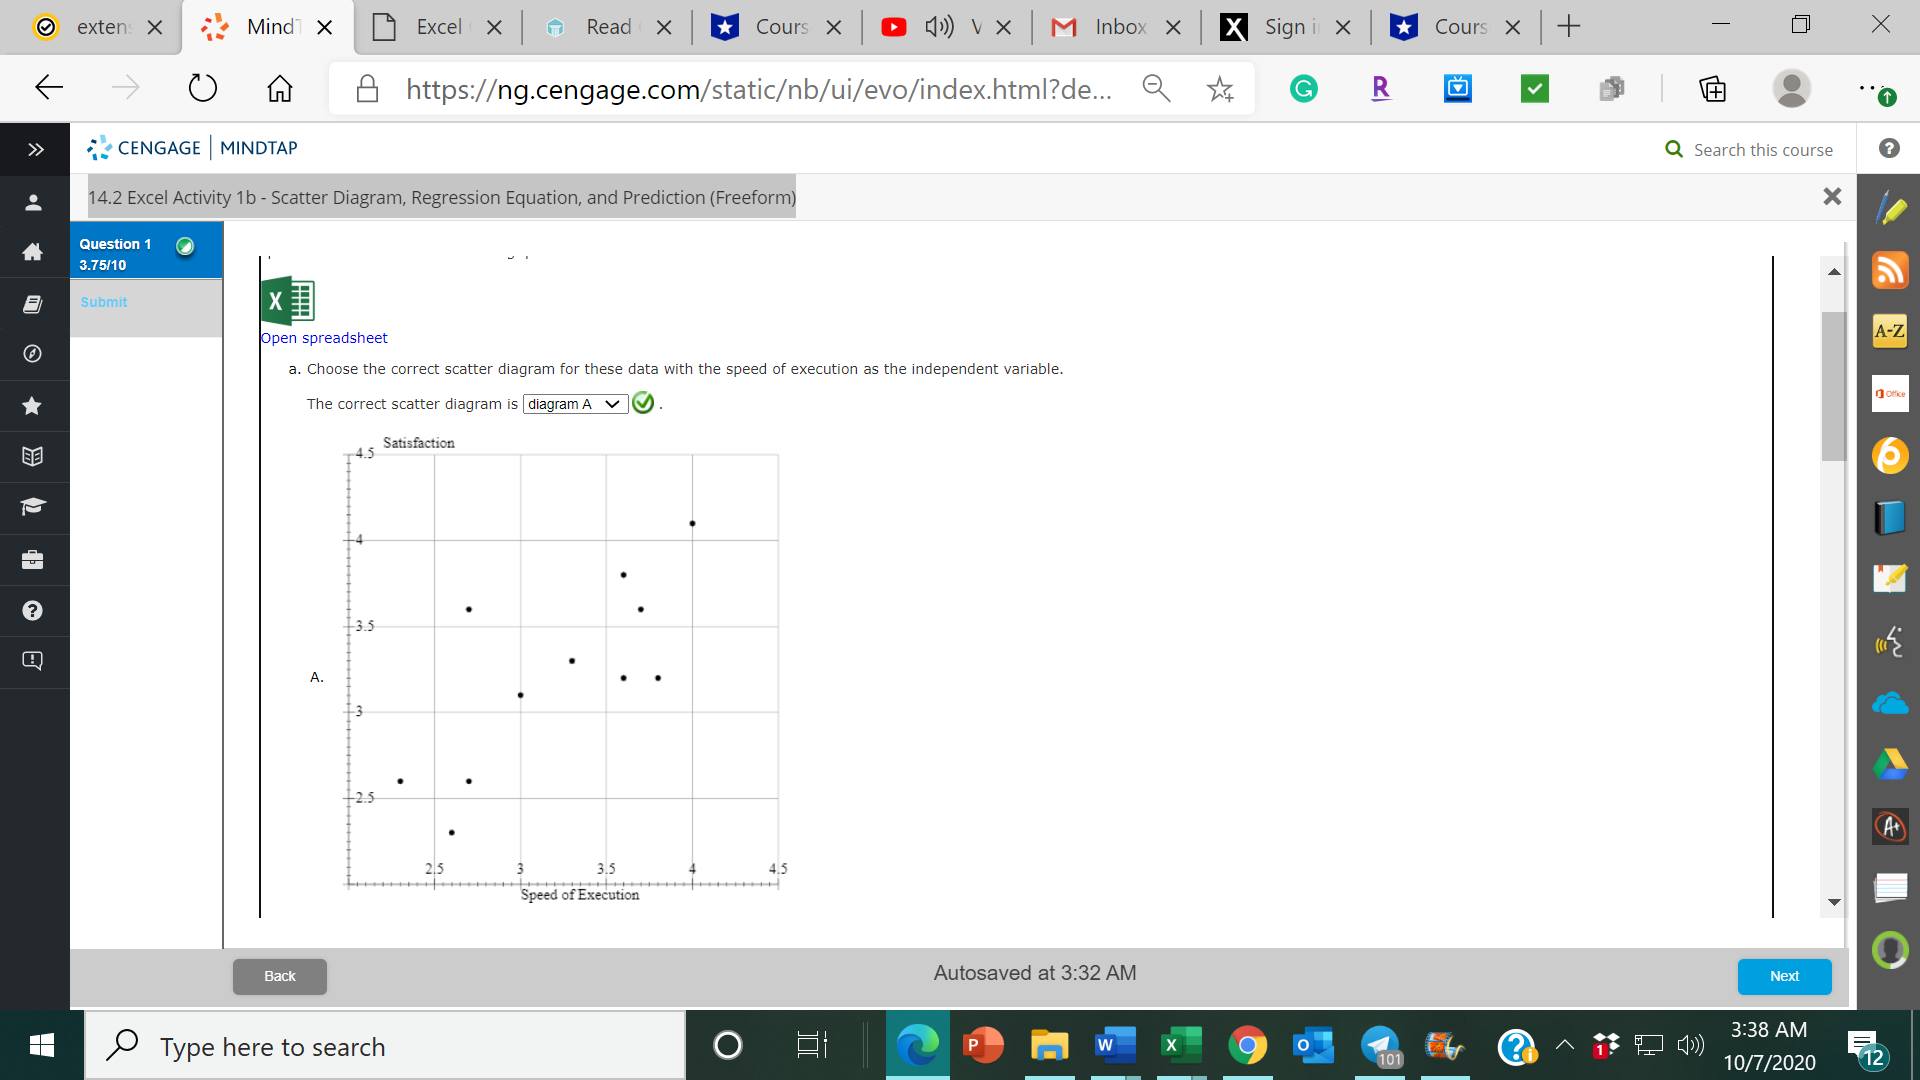
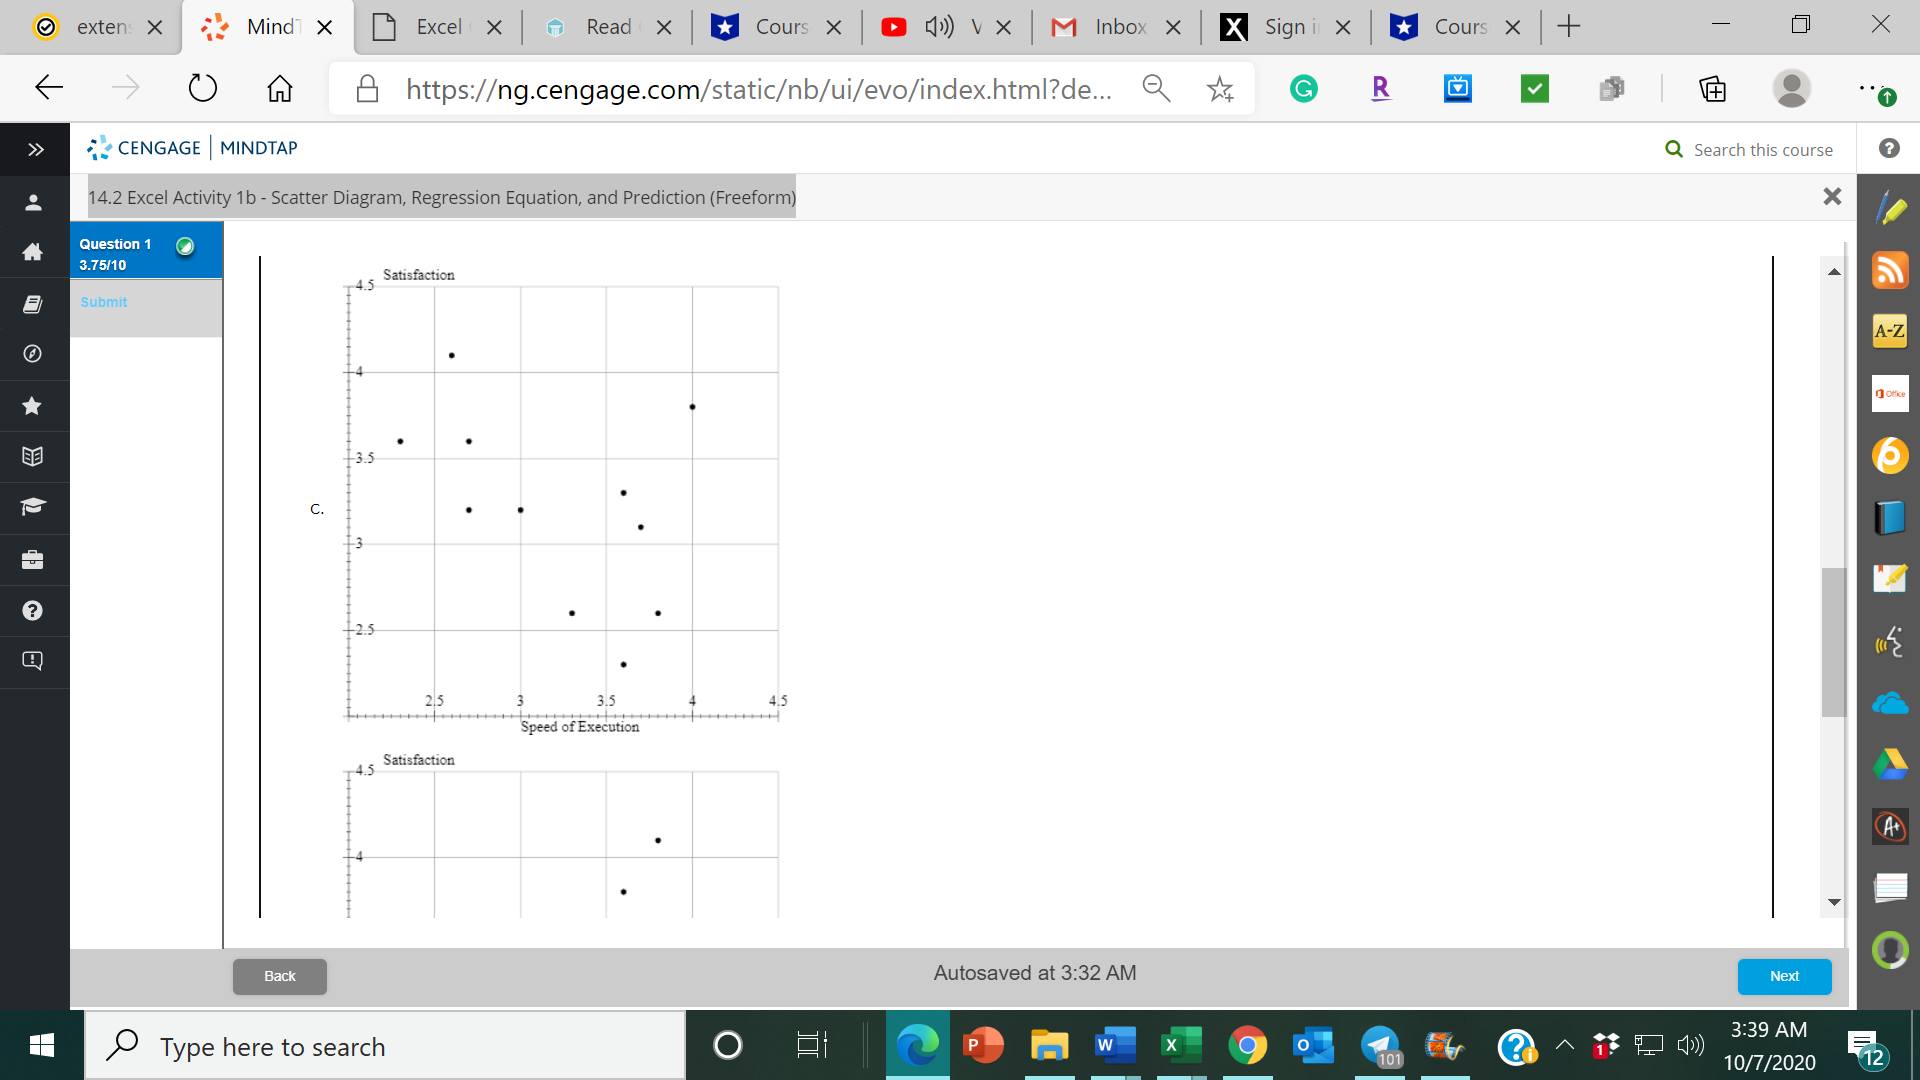
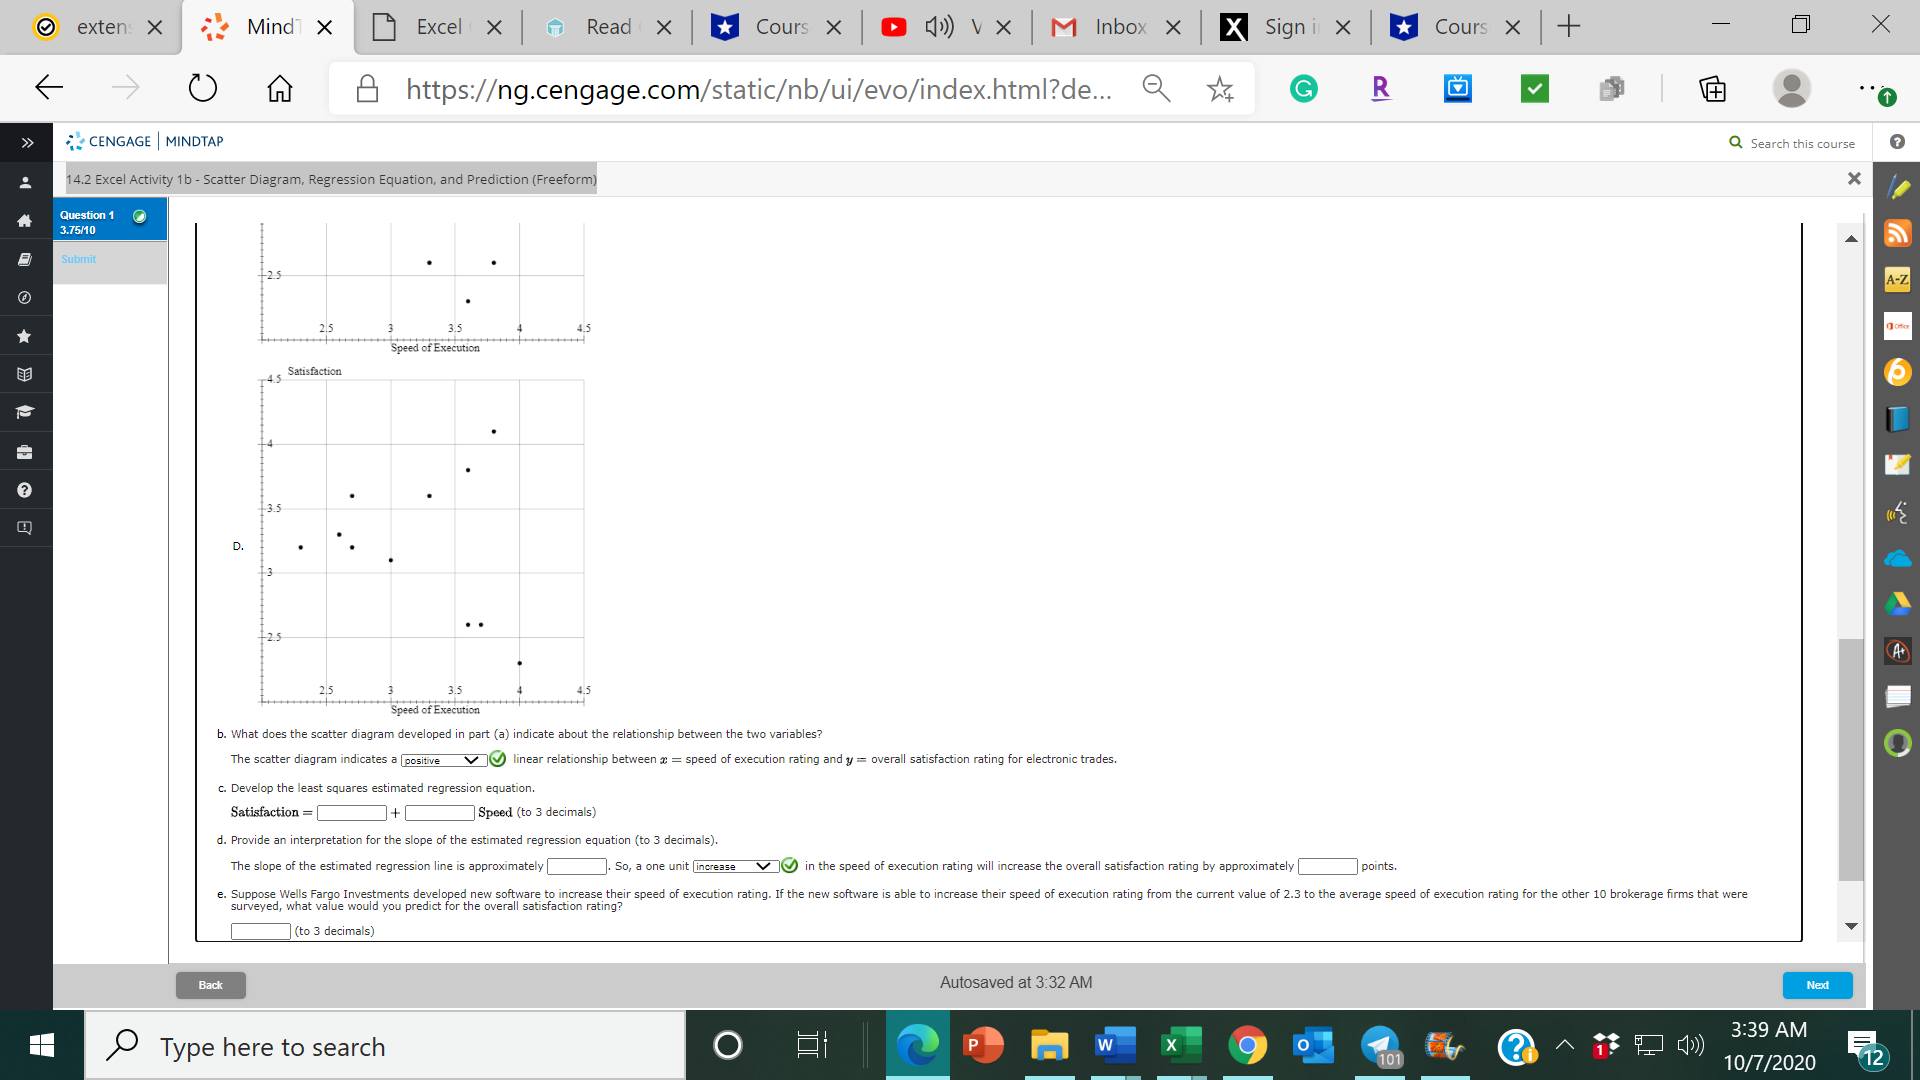
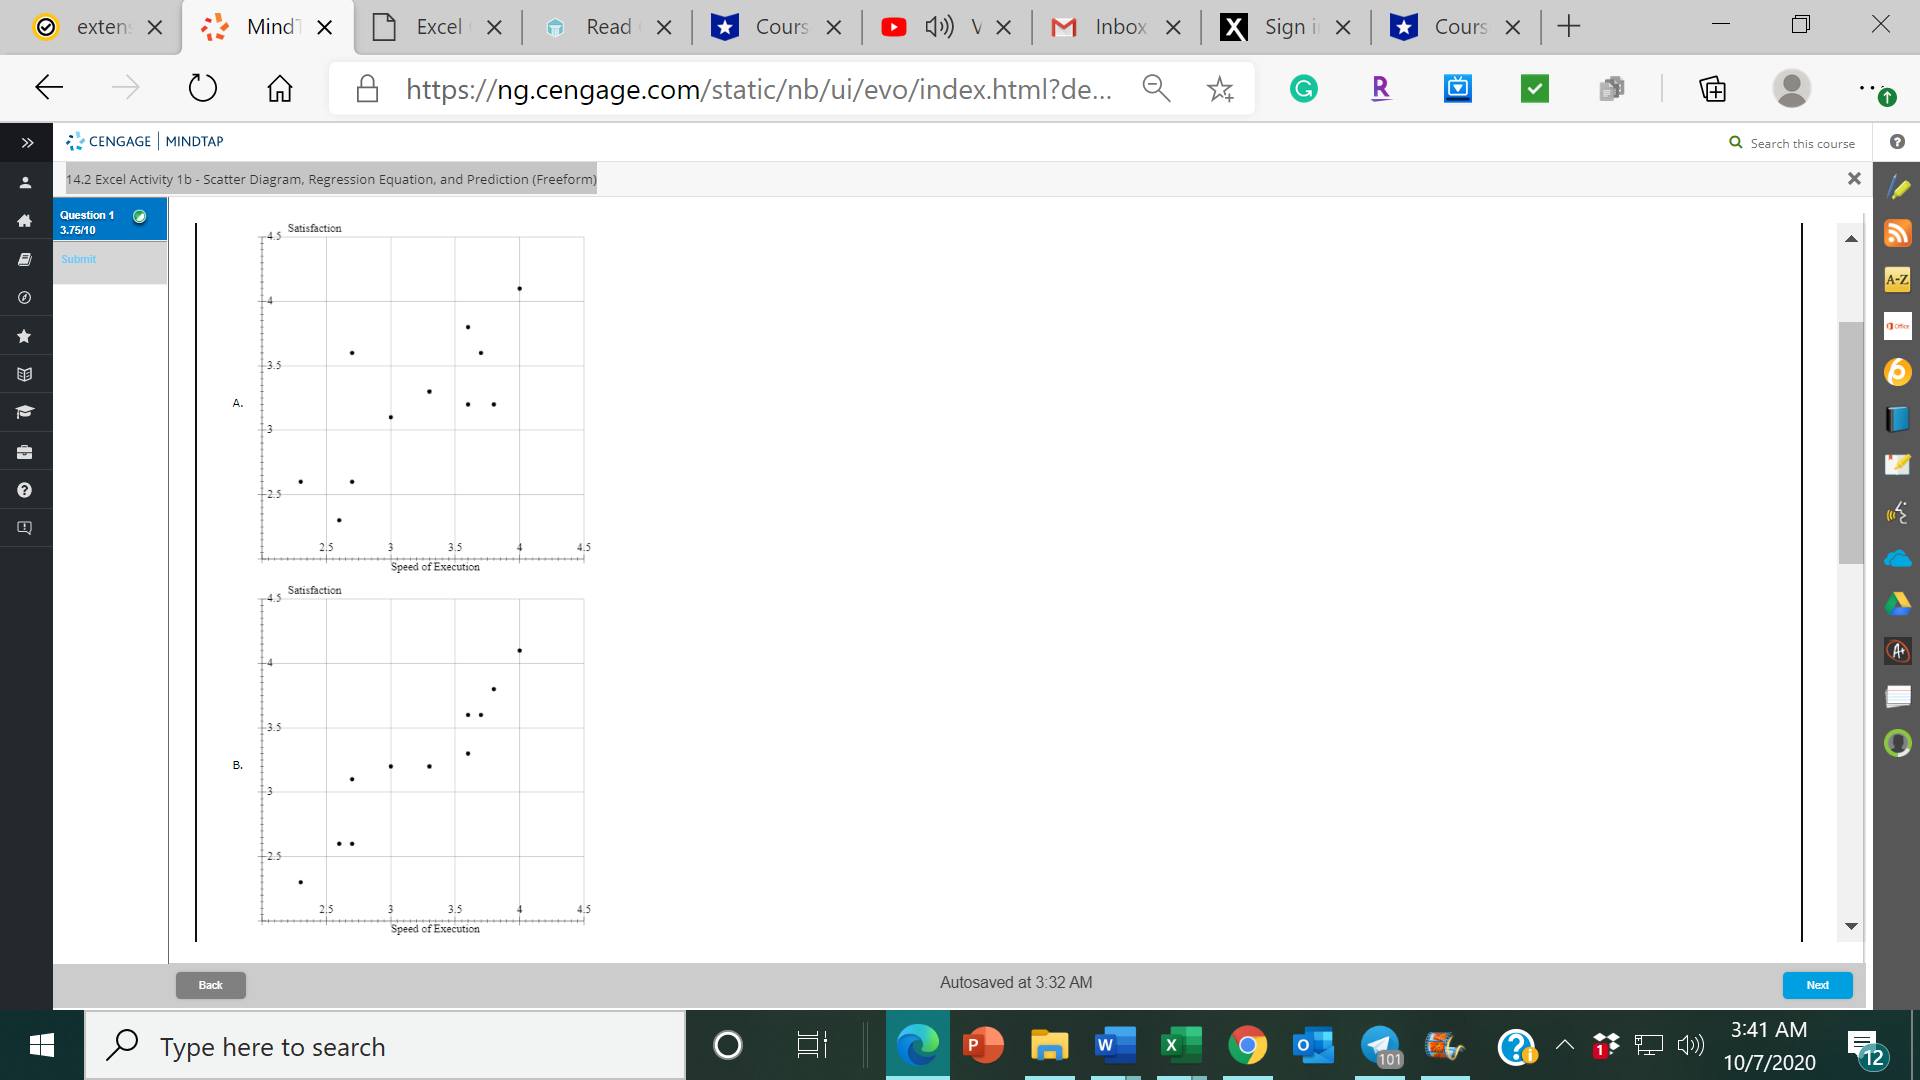
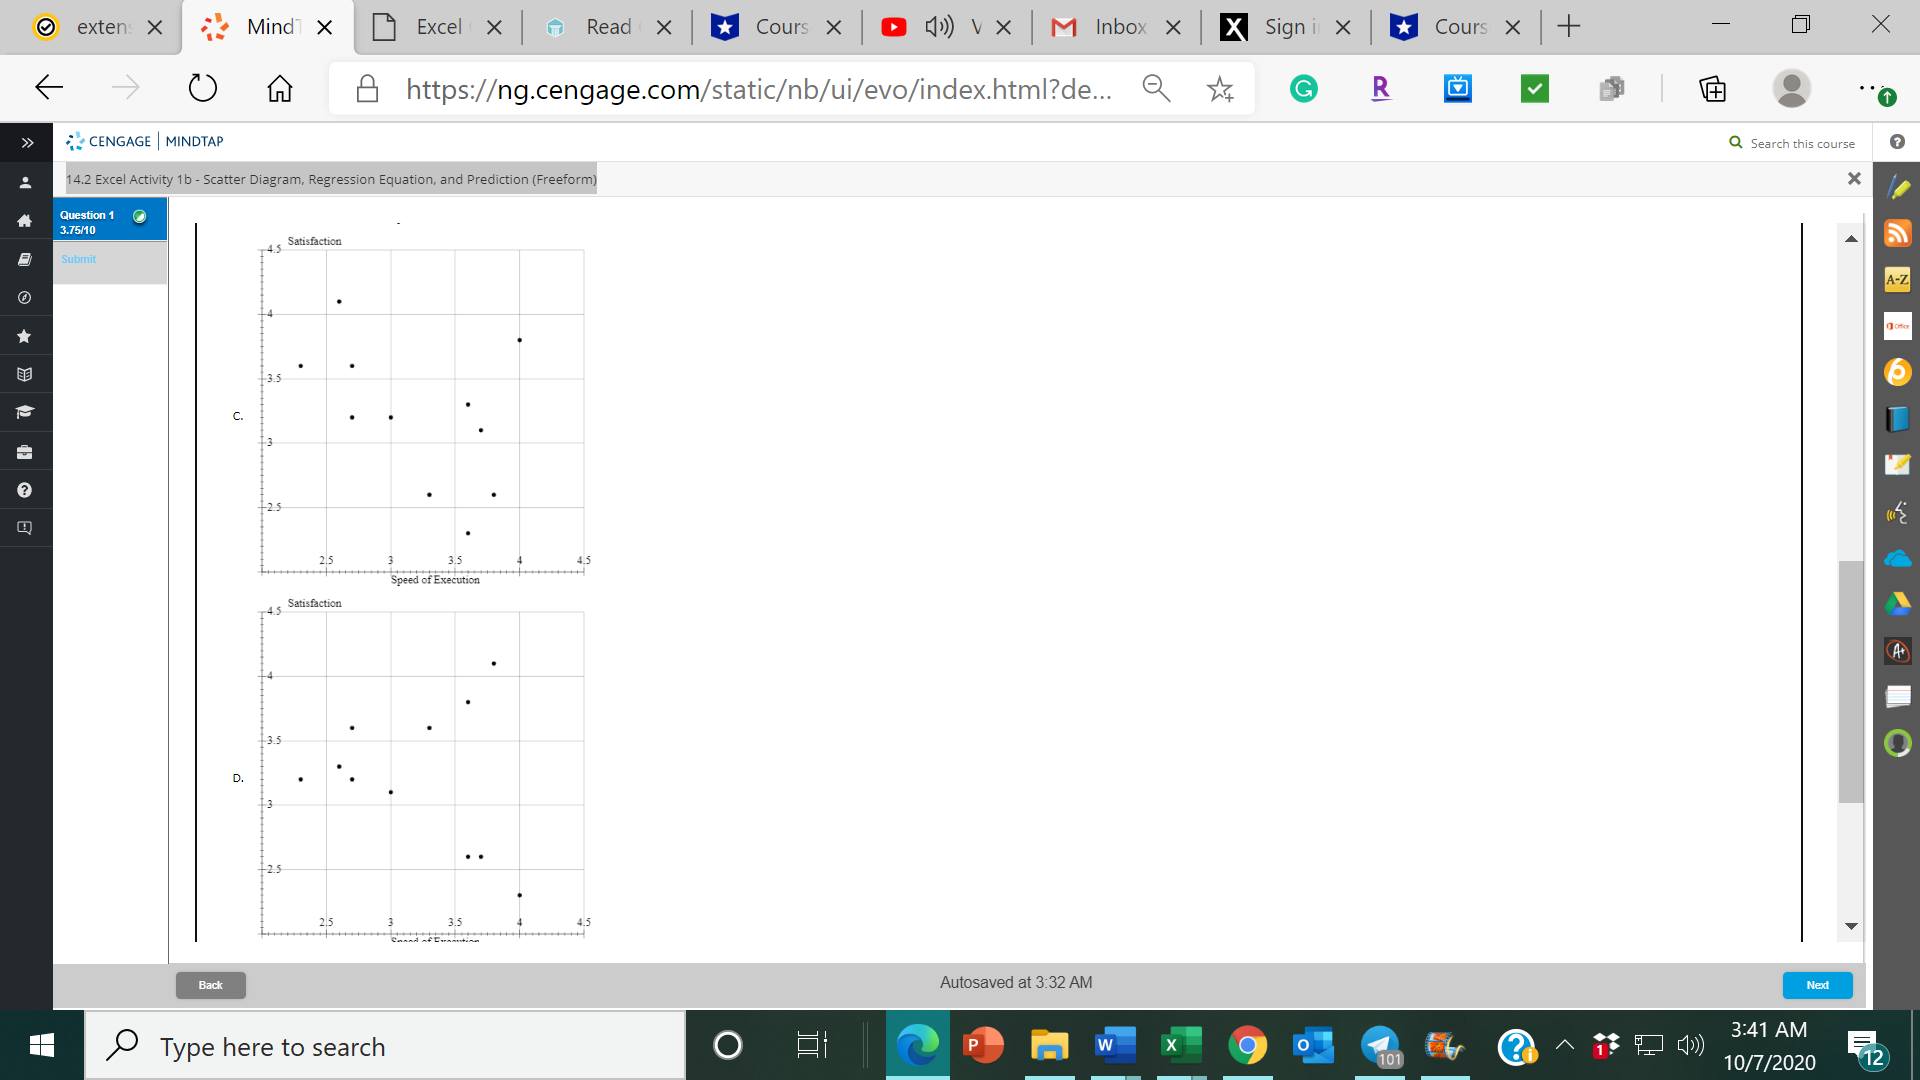
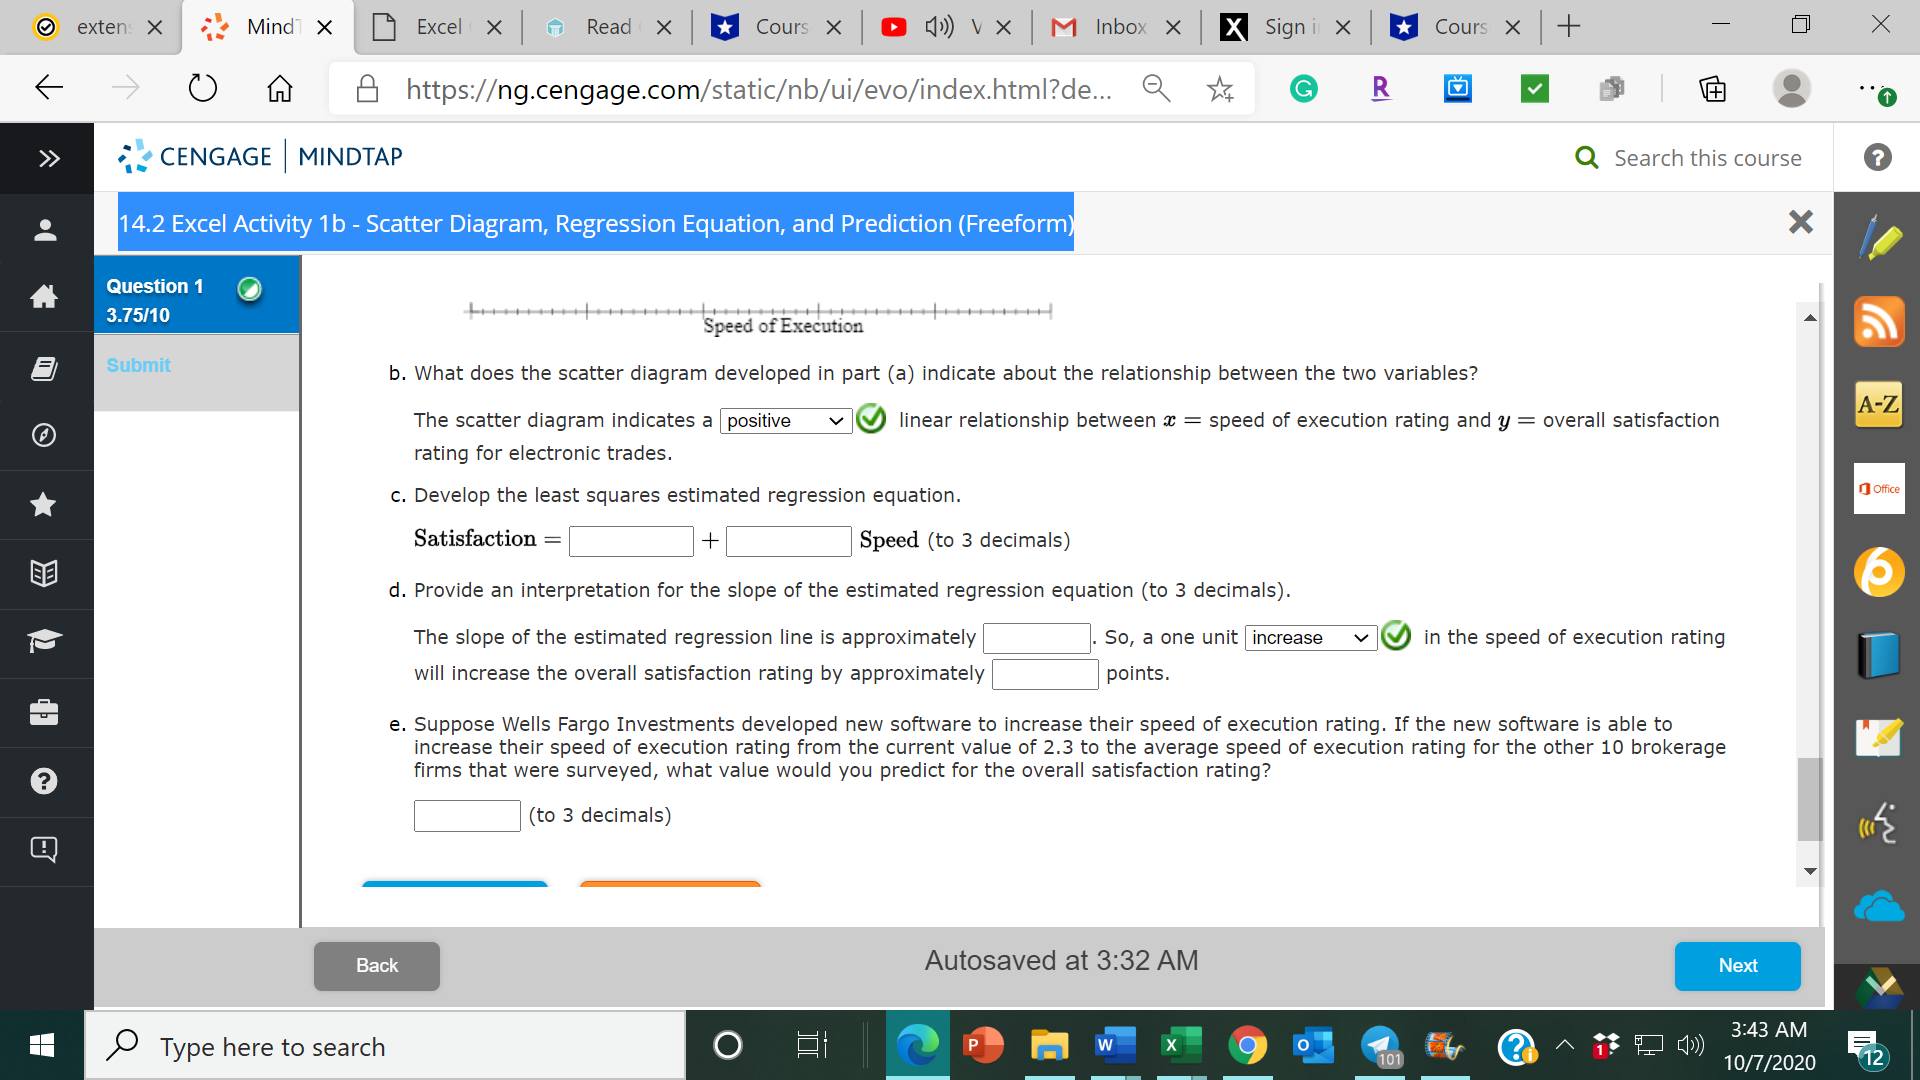
exten X Mind] X Excel X Read X Cours X 41)) V X M Inbox X X Sign i X Cours X + X https:/g.cengage.com/staticb/ui/evo/index.html?de... G R V CENGAGE | MINDTAP Q Search this course ? 14.2 Excel Activity 1b - Scatter Diagram, Regression Equation, and Prediction (Freeform) X Question 1 O 3.75/10 4.5 Satisfaction Submit A-Z B. ? . 2. 3.5 4.5 Speed of Execution 4.5 Satisfaction A+ Back Autosaved at 3:32 AM Next Type here to search O P W O 3:38 AM 101 10/7/2020 12exten X Mind] X Excel X Read X Cours X 41)) V X M Inbox X X Sign i X Cours X + X https:/g.cengage.com/staticb/ui/evo/index.html?de... G R V CENGAGE | MINDTAP Q Search this course ? 14.2 Excel Activity 1b - Scatter Diagram, Regression Equation, and Prediction (Freeform) X Question 1 3.75/10 Submit X Open spreadsheet A-Z a. Choose the correct scatter diagram for these data with the speed of execution as the independent variable. The correct scatter diagram is |diagram A V . 1 Office 4.5 Satisfaction ? 13.. A. -25 A+ 21 4.- Speed of Execution Back Autosaved at 3:32 AM Next Type here to search O EI P W O 3:38 AM 101 10/7/2020 12exten X Mind] X Excel X Read X Cours X 41)) V X M Inbox X X Sign i X Cours X + X https:/g.cengage.com/staticb/ui/evo/index.html?de... G R V CENGAGE | MINDTAP Q Search this course ? 14.2 Excel Activity 1b - Scatter Diagram, Regression Equation, and Prediction (Freeform) X Question 1 O 3.75/10 4.5 Satisfaction Submit A-Z 1 Office 13 C. ? 215 3 3.5 4.5 Speed of Execution Satisfaction A+ Back Autosaved at 3:32 AM Next Type here to search O P W O 3:39 AM 101 10/7/2020 12O exten: X Mind] X Excel X Read X Cours X 41)) V X M Inbox X X Sign i X Cours X + X https:/g.cengage.com/staticb/ui/evo/index.html?de... G R V > > CENGAGE | MINDTAP Q Search this course ? 14.2 Excel Activity 1b - Scatter Diagram, Regression Equation, and Prediction (Freeform) X Question 1 3.75/10 Submit A-Z 213 3.5 4.3 Speed of Execution as Satisfaction 14 ? 125 215 3.5 Speed of Execution . What does the scatter diagram developed in part (a) indicate about the relationship between the two variables? The scatter diagram indicates a positive linear relationship between a = speed of execution rating and y = overall satisfaction rating for electronic trades. O . Develop the least squares estimated regression equation. Satisfaction = + Speed (to 3 decimals) d. Provide an interpretation for the slope of the estimated regression equation (to 3 decimals). The slope of the estimated regression line is approximately| J. So, a one unit (increase V ) in the speed of execution rating will increase the overall satisfaction rating by approximately points. . Suppose Wells Fargo Investments developed new software to increase their speed of execution rating. If the new software is able to increase their speed of execution rating from the current value of 2.3 to the average speed of execution rating for the other 10 brokerage firms that were surveyed, what value would you predict for the overall satisfaction rating? (to 3 decimals) Back Autosaved at 3:32 AM Next Type here to search O P O 3:39 AM 101 10/7/2020 12O exten: X Mind] X Excel X Read X Cours X 41)) V X M Inbox X X Sign i X Cours X + X https:/g.cengage.com/staticb/ui/evo/index.html?de... G R V > > CENGAGE | MINDTAP Q Search this course ? 14.2 Excel Activity 1b - Scatter Diagram, Regression Equation, and Prediction (Freeform) X Question 1 3.75/10 45 Satisfaction Submit A-Z ? 125 3 3.5 4.5 Speed of Execution 4.5 Satisfaction At -3 125 21 3.5 Speed of Execution Back Autosaved at 3:32 AM Next Type here to search O EI P w O O 3:41 AM 101 10/7/2020 12O exten: X Mind] X Excel X Read X Cours X 41)) V X M Inbox X X Sign i X Cours X + X n https:/g.cengage.com/staticb/ui/evo/index.html?de... G R V > > CENGAGE | MINDTAP Q Search this course ? 14.2 Excel Activity 1b - Scatter Diagram, Regression Equation, and Prediction (Freeform) X Question 1 3.75/10 14 5 Satisfaction Submit A-Z 135 ? 125 21 3 3.5 Speed of Execution Satisfaction 4.5 At 3.5 Back Autosaved at 3:32 AM Next Type here to search O EI P w O O 3:41 AM 101 10/7/2020 12-:: Mind x [I] Izmir-x] .n my 5% ] \"fours 2x. I .- ail-V'x | M me: x I ll. sam- x [u tours x |+ a a! e O Q El https:/g.cengage.com/staticb/ui/evo/indexhthde... Q '31 e E E 5 g 1' CENGAGE l MINDTA? Q Search this course ty 1b - Scatter Diagram, Regression Equation, and Prediction (Freeform X Question 1 3 . 7 5'1 0 Lawm+~+4p~.+J.~_W++wm+~l_mq~\"4 A peed ofExecotion b. What does the scatter diagram developed in part (a) indicate about the relationship between the two variables? The scatter diagram indicates a @ linear relationship between :6 = speed of execution rating and y = overall satisfaction rating for electronic trades. c. Develop the least squares estimated regression equation. Satisfaction : E + I: Speed (to 3 decimals) d. Provide an interpretation for the slope of the estimated regression equation (to 3 decimals). The slope of the estimated regression line is approximately E. 50, a one unit @ in the speed of execution rating will increase the overall satisfaction rating by approximately 2 points. e. Suppose Wells Fargo Investments developed new software to increase their speed of execution rating. If the new software is able to increase their speed of execution rating from the current value of 2.3 to the average speed of execution rating for the other 10 brokerage firms that were surveyed, what value would you predict for the overall satisfaction rating? ,0 Type here to search ' ' . , - 7; El (iii. 3143 AM 10/7/2020 12 om Question 1 3.75110 52 Mind x [I] mew-x] 9 new 5% 1 time :x. | n WVX | M tame I ll. saw 2: ll: tours x |+ :2: CENGAGE | MINDTA? ty 'lb - Scatter Diagram, Regression Equation, and Prediction (Freeform El https:/g.cengage.com/staticb/ui/evo/indexhthdem Q '31 e E E 5 Some association On-Line Discount Broker Survey polls members on their experiences with discount brokers. As part of the survey, members were asked to rate the quality of the speed of execution with their broker as well as provide an overall satisfaction rating for electronic trades. Possible responses (scores) were no opinion (0), unsatisfied (i), somewhat satisfied (2), satisfied (3), and very satisfied (4). For each broker summary scores were computed by calculating a weighted average of the scores provided by each respondent. A portion of the survey results is contained in the Excel Dnline file below. Construct a spreadsheet to answer the following questions. Open spreadsheet a. Choose the correct scatter diagram for these data with the speed of execution as the independent variable. The correct scatter diagram is @ . {4'5 Satisfaction i i i4 /0 Type here to search ' ' , - T? i; tim- Q Search this course 3:43 AM 10/7/2020
Step by Step Solution
There are 3 Steps involved in it

Get step-by-step solutions from verified subject matter experts