

Question: 15. Does your 55% confidence interval from #12 include the value of 5.55? Does it include the value 5.55? Explain how your answers relate to
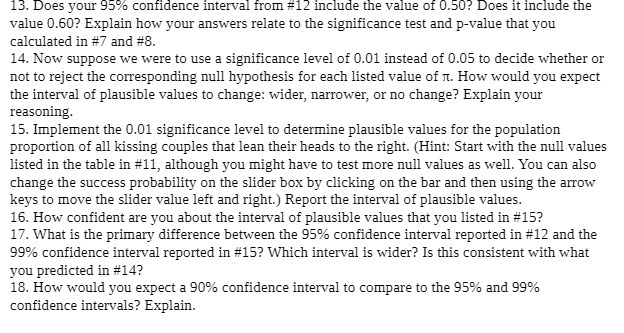
15. Does your 55% confidence interval from #12 include the value of 5.55? Does it include the value 5.55? Explain how your answers relate to the significance test and p-value that you calculated in #? and #5. 14. Now suppose we were to use a signicance level of 5.51 instead of {1.55 to decide whether or not to reject the corresponding null hypothesis for each listed value of it. How would you expect the interval of plausible values to change: wider, narrower, or no change? Explain your reasoning. 15. implement the 5.51 significance level to determine plausible values for the population proportion of all kissing couples that lean their heads to the right. (Hint: Start with the null values listed in the table in #113 although you might have to test more null values as well. You can also change the success probability on the slider box by clicking on the bar and then using the arrow keys to move the slider value left and right.) Report the interval of plausible values. 15. How condent are you about the interval of plausible values that you listed in #15? 1?. What is the primary difference between the 55% condence interval reported in #12 and the 55% confidence interval reported in #15? \"Which interval is wider? Is this consistent with what you predicted in #14? 15. How would you expect a 55% confidence interval to compare to the 55% and 55% confidence intervals? Explain
Step by Step Solution
There are 3 Steps involved in it

Get step-by-step solutions from verified subject matter experts