

Question: -15 J B D E 3 b. Construct an appropriate chart to show the relative value of mutual funds in each investment category. 4 5
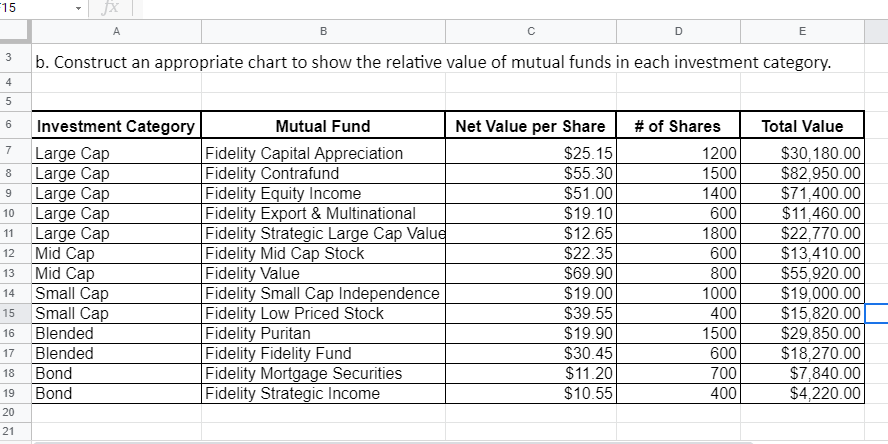
-15 J B D E 3 b. Construct an appropriate chart to show the relative value of mutual funds in each investment category. 4 5 6 7 8 9 10 11 12 Investment Category Mutual Fund Large Cap Fidelity Capital Appreciation Large Cap Fidelity Contrafund Large Cap Fidelity Equity Income Large Cap Fidelity Export & Multinational Large Cap Fidelity Strategic Large Cap Value Mid Cap Fidelity Mid Cap Stock Mid Cap Fidelity Value Small Cap Fidelity Small Cap Independence Small Cap Fidelity Low Priced Stock Blended Fidelity Puritan Blended Fidelity Fidelity Fund Bond Fidelity Mortgage Securities Bond Fidelity Strategic Income Net Value per Share $25.15 $55.30 $51.00 $19.10 $12.65 $22.35 $69.90 $19.00 $39.55 $19.90 $30.45 $11.20 $10.55 # of Shares 1200 1500 1400 600 1800 600 800 1000 400 1500 600 700 400 Total Value $30,180.00 $82,950.00 $71,400.00 $11,460.00 $22,770.00 $13,410.00 $55,920.00 $19,000.00 $15,820.00 $29,850.00 $18,270.00 $7,840.00 $4,220.00 13 14 15 16 17 18 19 20 21
Step by Step Solution
There are 3 Steps involved in it

Get step-by-step solutions from verified subject matter experts