

Question: (15 p) Examine the values given in the table below. They are the coordinate values of 7 points. Each point is expressed as (x, y).
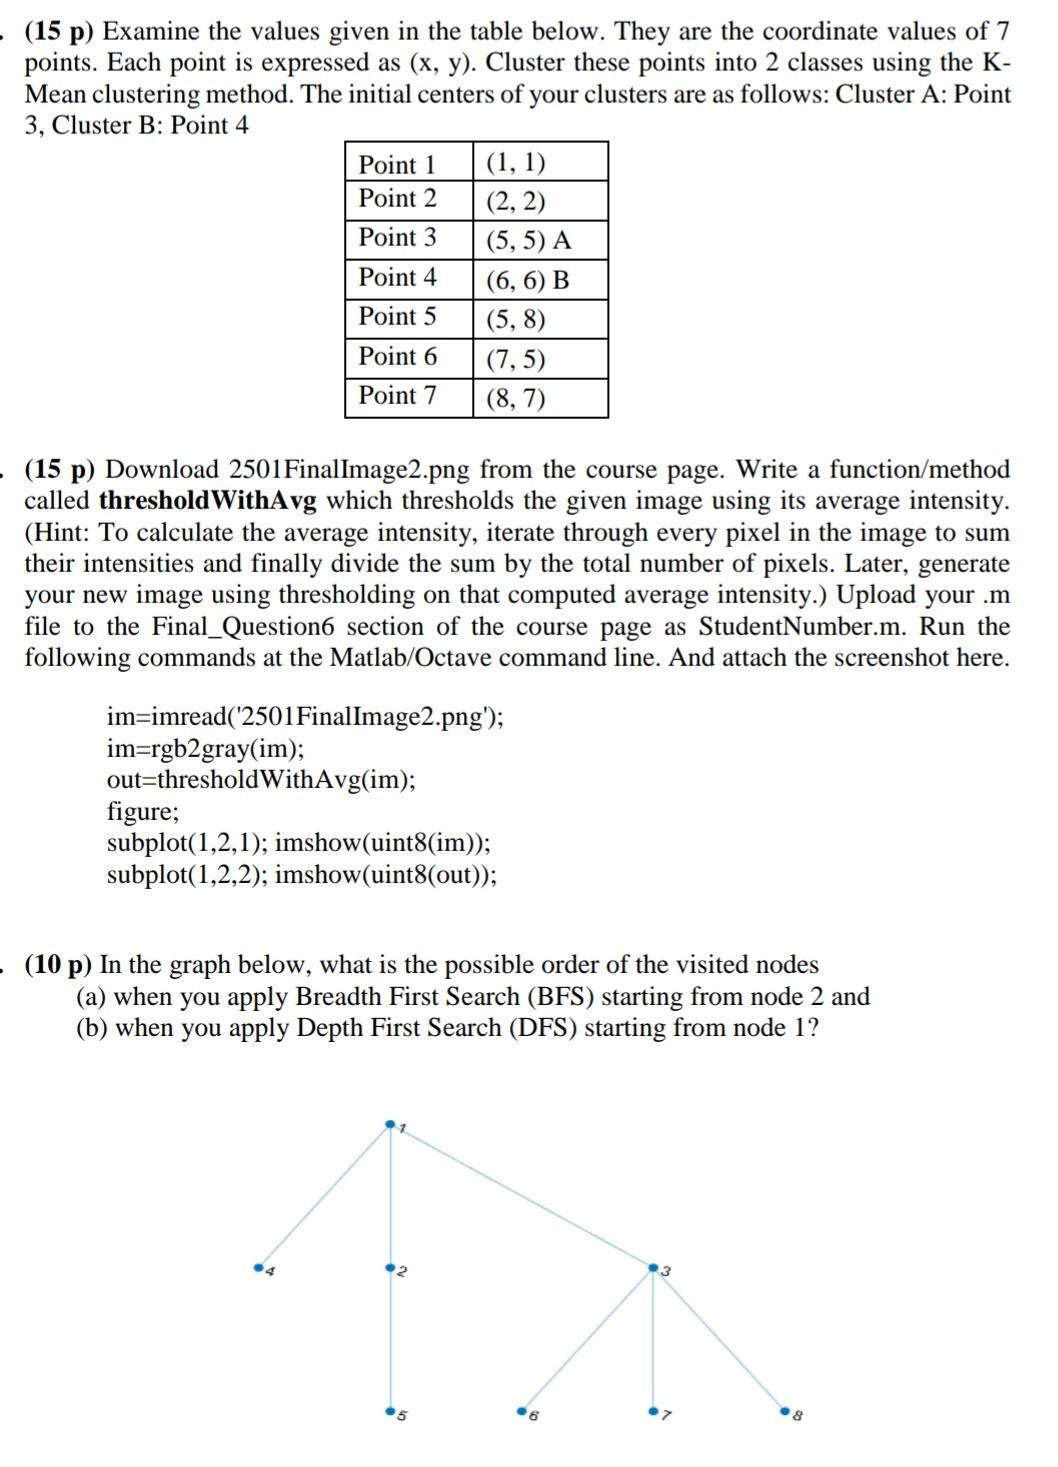
(15 p) Examine the values given in the table below. They are the coordinate values of 7 points. Each point is expressed as (x, y). Cluster these points into 2 classes using the K- Mean clustering method. The initial centers of your clusters are as follows: Cluster A: Point 3, Cluster B: Point 4 Point 1 (1, 1) Point 2 (2, 2) Point 3 (5,5) A Point 4 (6, 6) B Point 5 (5,8) Point 6 (7,5) Point 7 (8,7) (15 p) Download 2501 FinalImage2.png from the course page. Write a function/method called threshold WithAvg which thresholds the given image using its average intensity. (Hint: To calculate the average intensity, iterate through every pixel in the image to sum their intensities and finally divide the sum by the total number of pixels. Later, generate your new image using thresholding on that computed average intensity.) Upload your .m file to the Final_Question6 section of the course page as StudentNumber.m. Run the following commands at the Matlab/Octave command line. And attach the screenshot here. im=imread('2501FinalImage2.png'); im=rgb2gray(im); out=threshold WithAvg(im); figure; subplot(1,2,1); imshow(uint8(im)); subplot(1,2,2); imshow(uint8(out)); (10 p) In the graph below, what is the possible order of the visited nodes (a) when you apply Breadth First Search (BFS) starting from node 2 and (b) when you apply Depth First Search (DFS) starting from node 1? 6 .8
Step by Step Solution
There are 3 Steps involved in it

Get step-by-step solutions from verified subject matter experts