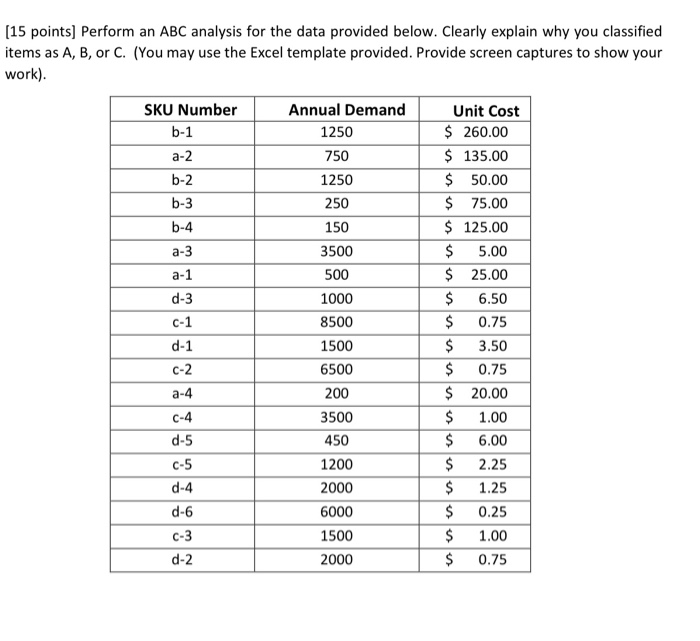
Question: (15 points) Perform an ABC analysis for the data provided below. Clearly explain why you classified items as A, B, or C. (You may use

(15 points) Perform an ABC analysis for the data
(15 points) Perform an ABC analysis for the data provided below. Clearly explain why you classified items as A, B, or C. (You may use the Excel template provided. Provide screen captures to show your work). SKU Number b-1 a-2 b-2 b-3 b-4 a-3 a-1 d-3 C-1 d-1 $ Annual Demand 1250 750 1250 250 150 3500 500 1000 8500 1500 6500 200 3500 450 1200 2000 6000 1500 2000 Unit Cost $ 260.00 $ 135.00 $ 50.00 $ 75.00 $ 125.00 $ 5.00 $ 25.00 $ 6.50 0.75 3.50 0.75 $ 20.00 $ 1.00 6.00 2.25 1.25 0.25 1.00 0.75 C-2 $ a-4 C-4 d-5 is C-5 $ d-4 d-6 C-3 d-2

Step by Step Solution

There are 3 Steps involved in it

1 Expert Approved Answer
Step: 1 Unlock blur-text-image
Question Has Been Solved by an Expert!

Get step-by-step solutions from verified subject matter experts

Step: 2 Unlock
Step: 3 Unlock

Students Have Also Explored These Related General Management Questions!