

Question: 16. How many variables are represented in this graph? a) 1 b) 2 c) 3 d) 4 e) 12 100% 80% 60% 40% 20%
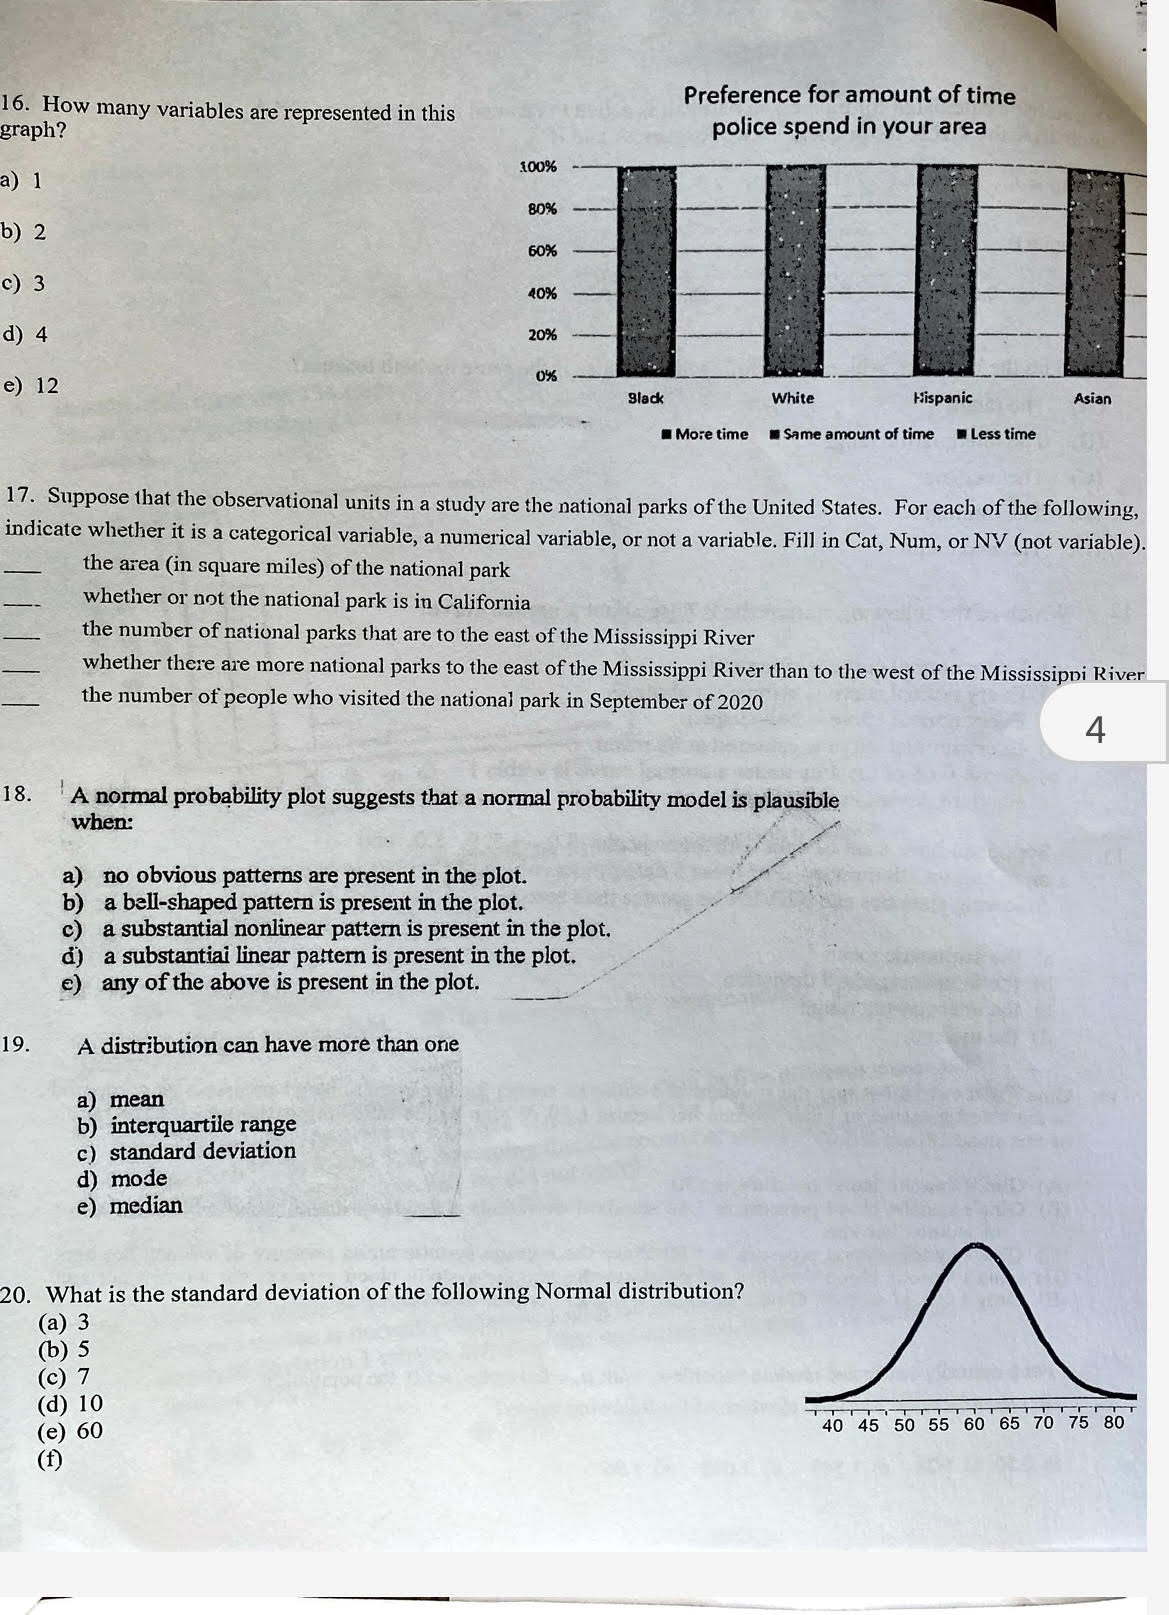
16. How many variables are represented in this graph? a) 1 b) 2 c) 3 d) 4 e) 12 100% 80% 60% 40% 20% Preference for amount of time police spend in your area IIII 0% Black White Hispanic More time Same amount of time Less time Asian 17. Suppose that the observational units in a study are the national parks of the United States. For each of the following, indicate whether it is a categorical variable, a numerical variable, or not a variable. Fill in Cat, Num, or NV (not variable). the area (in square miles) of the national park whether or not the national park is in California the number of national parks that are to the east of the Mississippi River whether there are more national parks to the east of the Mississippi River than to the west of the Mississippi River the number of people who visited the national park in September of 2020 18. A normal probability plot suggests that a normal probability model is plausible when: a) no obvious patterns are present in the plot. b) a bell-shaped pattern is present in the plot. c) a substantial nonlinear pattern is present in the plot. d) a substantial linear pattern is present in the plot. e) any of the above is present in the plot. 19. A distribution can have more than one a) mean b) interquartile range c) standard deviation d) mode e) median 20. What is the standard deviation of the following Normal distribution? (a) 3 (b) 5 (c) 7 (d) 10 (e) 60 4 T 40 45 50 55 60 65 70 75 80
Step by Step Solution
There are 3 Steps involved in it

Get step-by-step solutions from verified subject matter experts