

Question: 16 Listed in the table below are annual data for various years. The data are weights (metric tons) of lemons imported from Mexico and US.
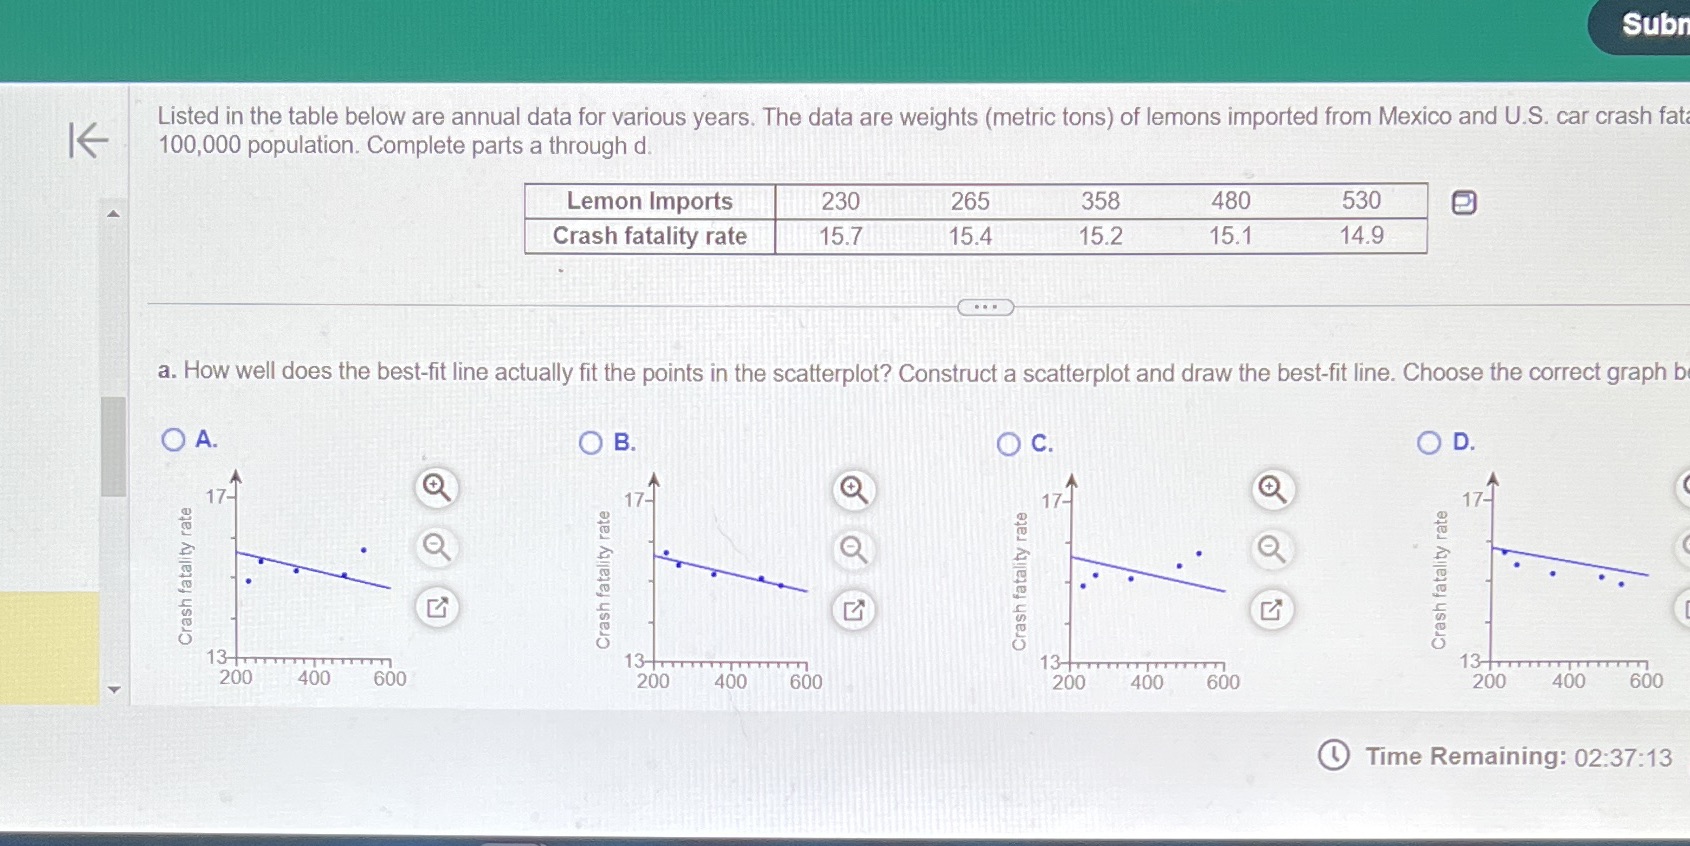
16 Listed in the table below are annual data for various years. The data are weights (metric tons) of lemons imported from Mexico and US. car crash fate 100,000 population. Complete parts a through d Lemon Imports 230 265 358 480 530 9 Crash fatality rate 15.7 15.4 15.2 15.1 14.9 ,7" . . E} ,,,,,,......._ _.._..... a. How well does the bestt line actually t the points in the scatterplot'? Construct a scatterplot and draw the best-t line. Choose the correct graph bl O A. O B. O c, O D. 17 9' 17 Q 17 ( 2 g In 93 E 9 E 9 g - Q a - Q a i? ( CD a _. TV a E? 5. 12: I 5 t E 9 3 :3 U o O o 1 t 200 400 600 200 400 500 200 400 600 Tlme Remaining: 02:37:13
Step by Step Solution
There are 3 Steps involved in it

Get step-by-step solutions from verified subject matter experts