

Question: 16 points Consider the dataset from the World Bank discussed early in the semester. The dataset includes information from the year 2019 for 177
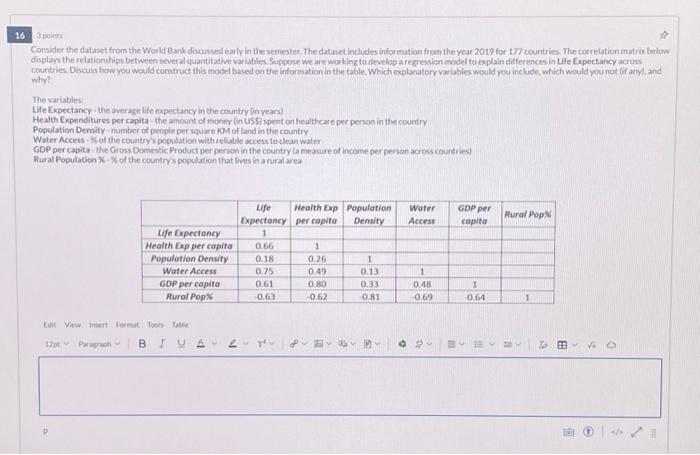
16 points Consider the dataset from the World Bank discussed early in the semester. The dataset includes information from the year 2019 for 177 countries. The correlation matrix below displays the relationships between several quantitative variables. Suppose we are working to develop a regression model to explain differences in Life Expectancy across countries. Discuss how you would construct this model based on the information in the table. Which explanatory variables would you include, which would you not if any), and why? The variables: Life Expectancy the average life expectancy in the country (in years) Health Expenditures per capita-the amount of money (in US$) spent on healthcare per person in the country Population Density-number of people per square KM of land in the country Water Access-% of the country's population with reliable access to clean water GDP per capita the Gross Domestic Product per person in the country (a measure of income per person across countries) Rural Population % % of the country's population that lives in a rural area 5 Life Expectancy Life Expectancy 1 Health Exp Population per capita Water GDP per Rural Pop% Density Access capita Health Exp per capita 0.66 1 Population Density 0.18 0.26 1 Water Access 0.75 0.491 0.13 1 GDP per capita 0.61 0.80 0.33 0.48 1 Rural Pop% 0.63 -0.62 0.81 0.69 0.64 1 Edit View Imert Format Tools Table 3 120 Paragraph B TUATE ~~ Dr 9 5M
Step by Step Solution
There are 3 Steps involved in it

Get step-by-step solutions from verified subject matter experts