

Question: 16. The chart below contains data representing the amount of average monthly precipitation recorded at Grouse mountain in North Vancouver. Plot a scatter plot of
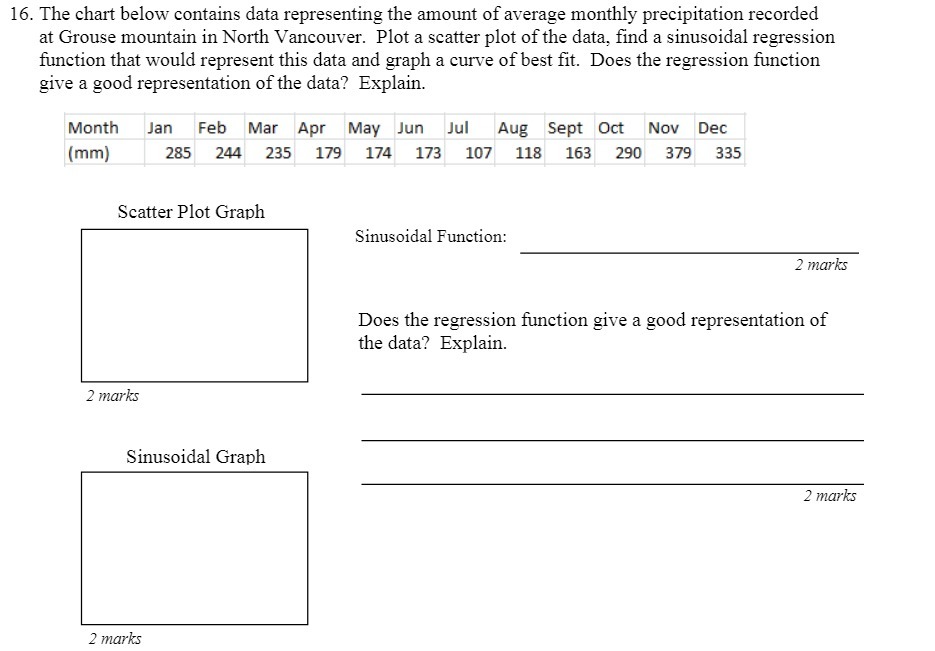
16. The chart below contains data representing the amount of average monthly precipitation recorded at Grouse mountain in North Vancouver. Plot a scatter plot of the data, find a sinusoidal regression function that would represent this data and graph a curve of best fit. Does the regression function give a good representation of the data? Explain. Month Jan Feb Mar Apr May Jun Jul Aug Sept Oct Nov Dec (mm) 285 244 235 179 174 173 107 118 163 290 379 335 Scatter Plot Graph Sinusoidal Function: 2 marks Does the regression function give a good representation of the data? Explain. 2 marks Sinusoidal Graph 2 marks 2 marks
Step by Step Solution
There are 3 Steps involved in it
1 Expert Approved Answer
Step: 1 Unlock

Question Has Been Solved by an Expert!
Get step-by-step solutions from verified subject matter experts
Step: 2 Unlock
Step: 3 Unlock