

Question: 16. The data in the table represents the average number of daylight hours each month in Springfield in 2015, rounded to the nearest quarter-hour.
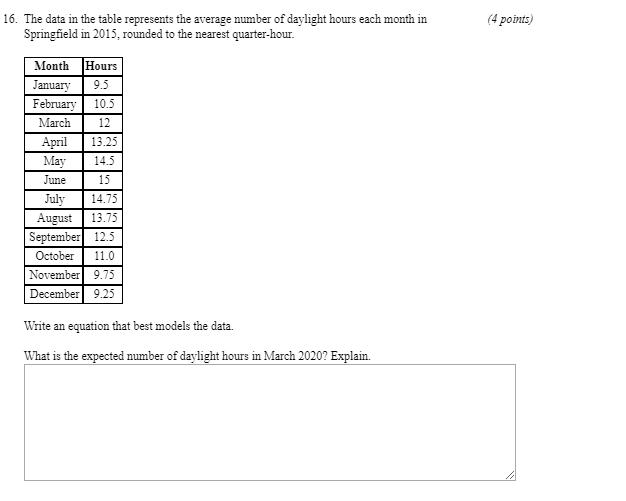
16. The data in the table represents the average number of daylight hours each month in Springfield in 2015, rounded to the nearest quarter-hour. Month Hours January 9.5 February 10.5 March 12 April 13.25 May 14.5 June 15 July 14.75 August 13.75 September 12.5 October 11.0 November 9.75 December 9.25 Write an equation that best models the data. What is the expected number of daylight hours in March 2020? Explain. (4 points)
Step by Step Solution
3.46 Rating (153 Votes )
There are 3 Steps involved in it
looks like a cos let minimum 95 at t and maximum 15 at t6 go amplitude is A Vertical shift is 1... View full answer

Get step-by-step solutions from verified subject matter experts