

Question: 16849 (700271) Figure 17.6 shows a queueing network with three FCFS servers. All servers have Exponentially distributed service times with rates as shown. Outside arrivals
16849 (700271)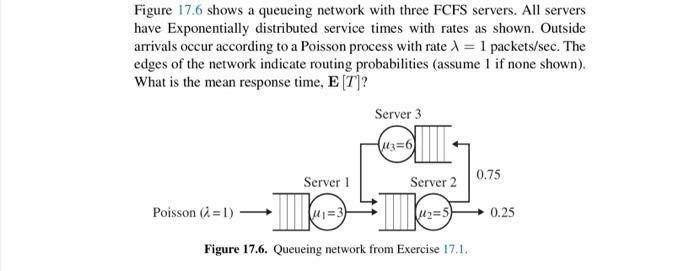
Figure 17.6 shows a queueing network with three FCFS servers. All servers have Exponentially distributed service times with rates as shown. Outside arrivals occur according to a Poisson process with rate =1 packets/sec. The edges of the network indicate routing probabilities (assume 1 if none shown). What is the mean response time, E[T] ? Figure 17.6. Queueing network from Exercise 17.1
Step by Step Solution
There are 3 Steps involved in it
1 Expert Approved Answer
Step: 1 Unlock

Question Has Been Solved by an Expert!
Get step-by-step solutions from verified subject matter experts
Step: 2 Unlock
Step: 3 Unlock