

Question: 16AA Wrap Text General Paste Conditional For .00 ) Formatting + Clipboard Font Number F18 Ratio Analysis: Using Excel for key performance indicators (KPls) s
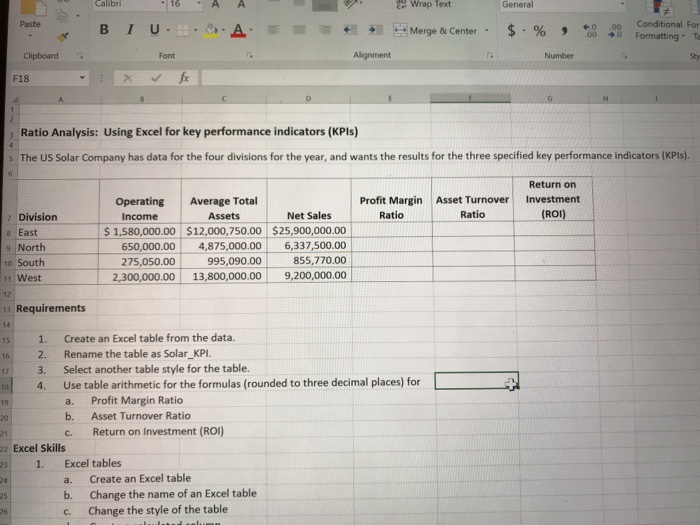
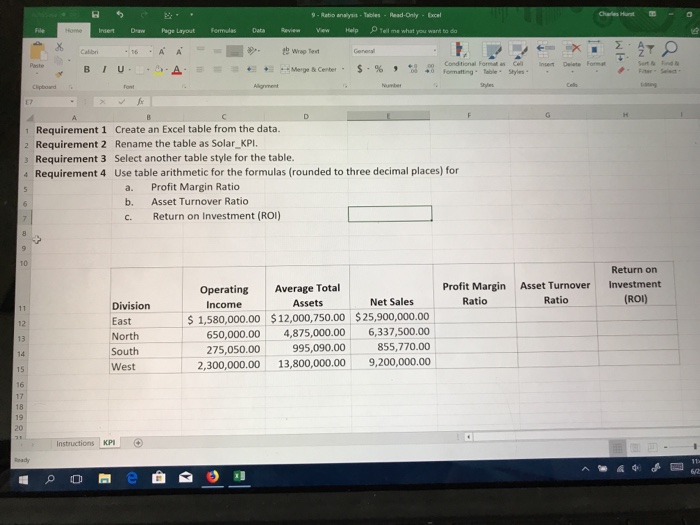
16AA Wrap Text General Paste Conditional For .00 ) Formatting + Clipboard Font Number F18 Ratio Analysis: Using Excel for key performance indicators (KPls) s The US Solar Company has data for the four divisions for the year, and wants the results for the three specified key performance indicators (KPis) Return on Profit Margin Asset Turnover Investment Ratio Operating Average Total Income 1,580,000.00 12,000,750.00 $25,900,000.00 650,000.00 4,875,000.00 6,337,500.00 75,050.00995,090.00855,770.00 2,300,000.00 13,800,000.00 9,200,000.00 Assets Net Sales Ratio ROI) ? East North o South 1 West Requirements 14 15 1. Create an Excel table from the data. 16 2. Rename the table as Solar_KPl. 17 3. Select another table style for the table. Use table arithmetic for the formulas (rounded to three decimal places) for a. b. c. Return on Investment (ROI) 4. Profit Margin Ratio Asset Turnover Ratio 19 20 2 Excel Skills 231. Excel tables 24 25 26 a. Create an Excel table b. Change the name of an Excel table c. Change the style of the table
Step by Step Solution
There are 3 Steps involved in it

Get step-by-step solutions from verified subject matter experts