

Question: 17. Chapter ma2pe09r, Section .16, Problem 035 (ID): 035.16.MANK09) Figure 16-2 This figure depicts a situation in a monopolistically competitive market. 100 90 80 70
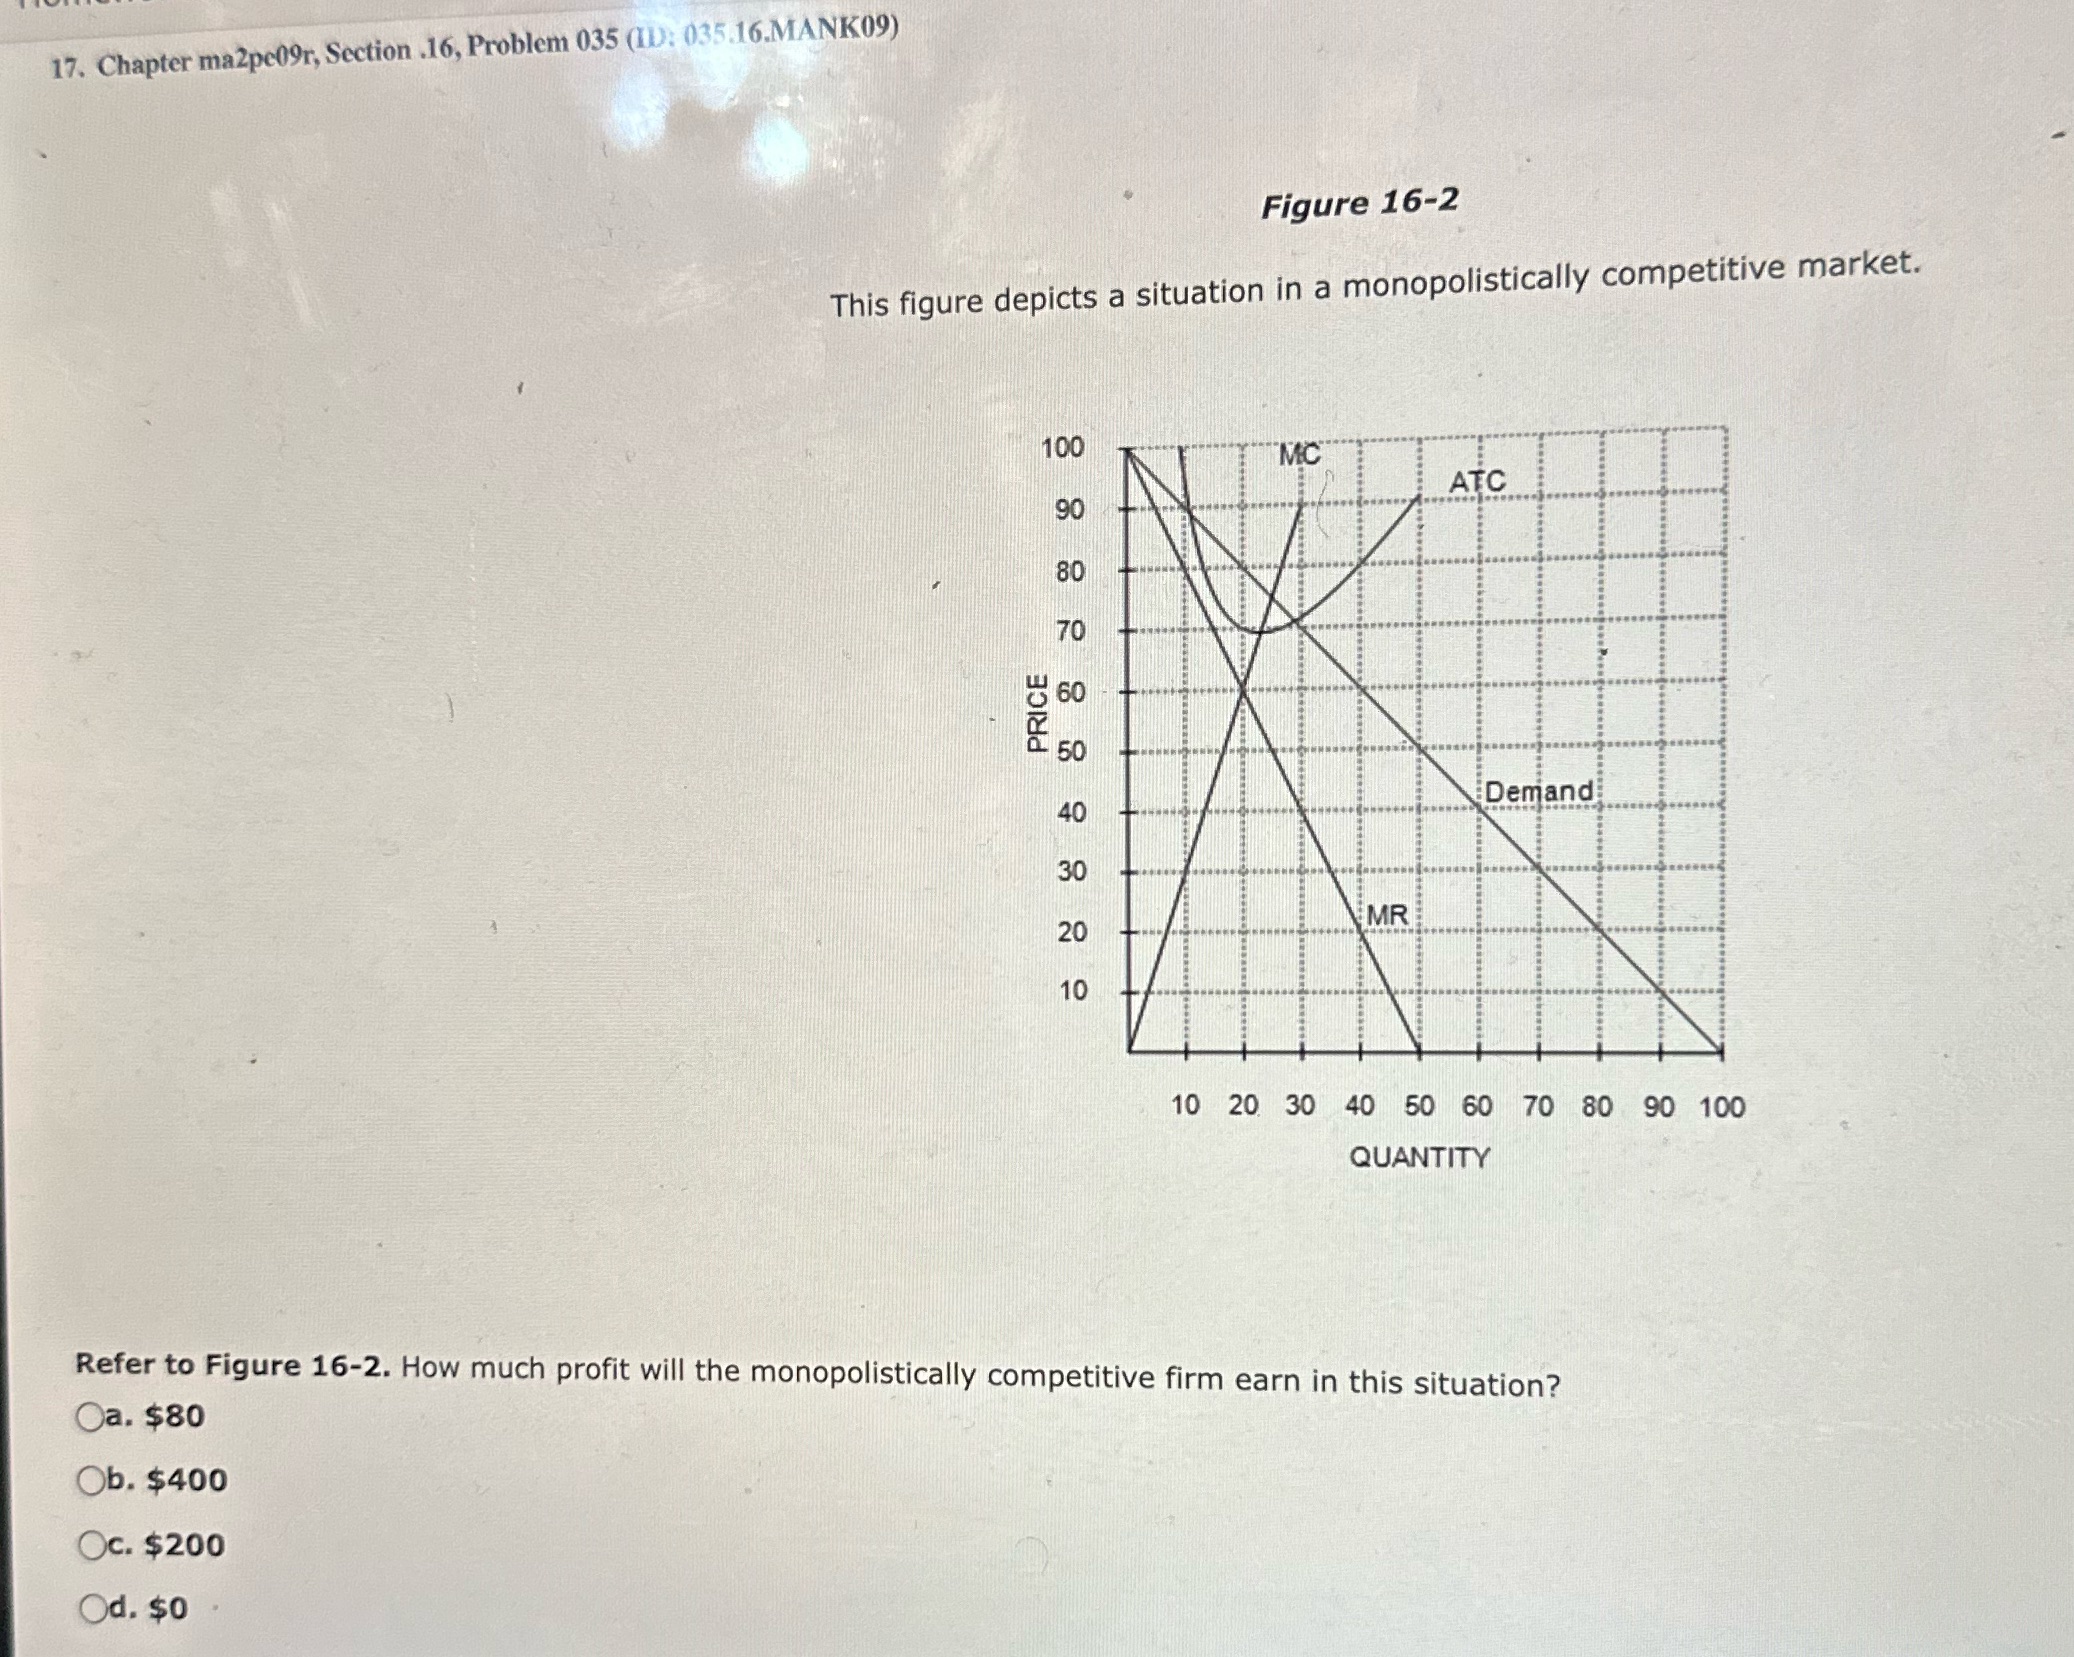
17. Chapter ma2pe09r, Section .16, Problem 035 (ID): 035.16.MANK09) Figure 16-2 This figure depicts a situation in a monopolistically competitive market. 100 90 80 70 60 PRICE Demand 8 8 85 10 20 30 40 50 60 70 80 90 100 QUANTITY Refer to Figure 16-2. How much profit will the monopolistically competitive firm earn in this situation? Oa. $80 Ob. $400 Oc. $200 Od. $0
Step by Step Solution
There are 3 Steps involved in it
1 Expert Approved Answer
Step: 1 Unlock

Question Has Been Solved by an Expert!
Get step-by-step solutions from verified subject matter experts
Step: 2 Unlock
Step: 3 Unlock