

Question: 17.) The graph shows the magnetic field as a function of time through a closed conducting loop. During which interval is the magnitude of
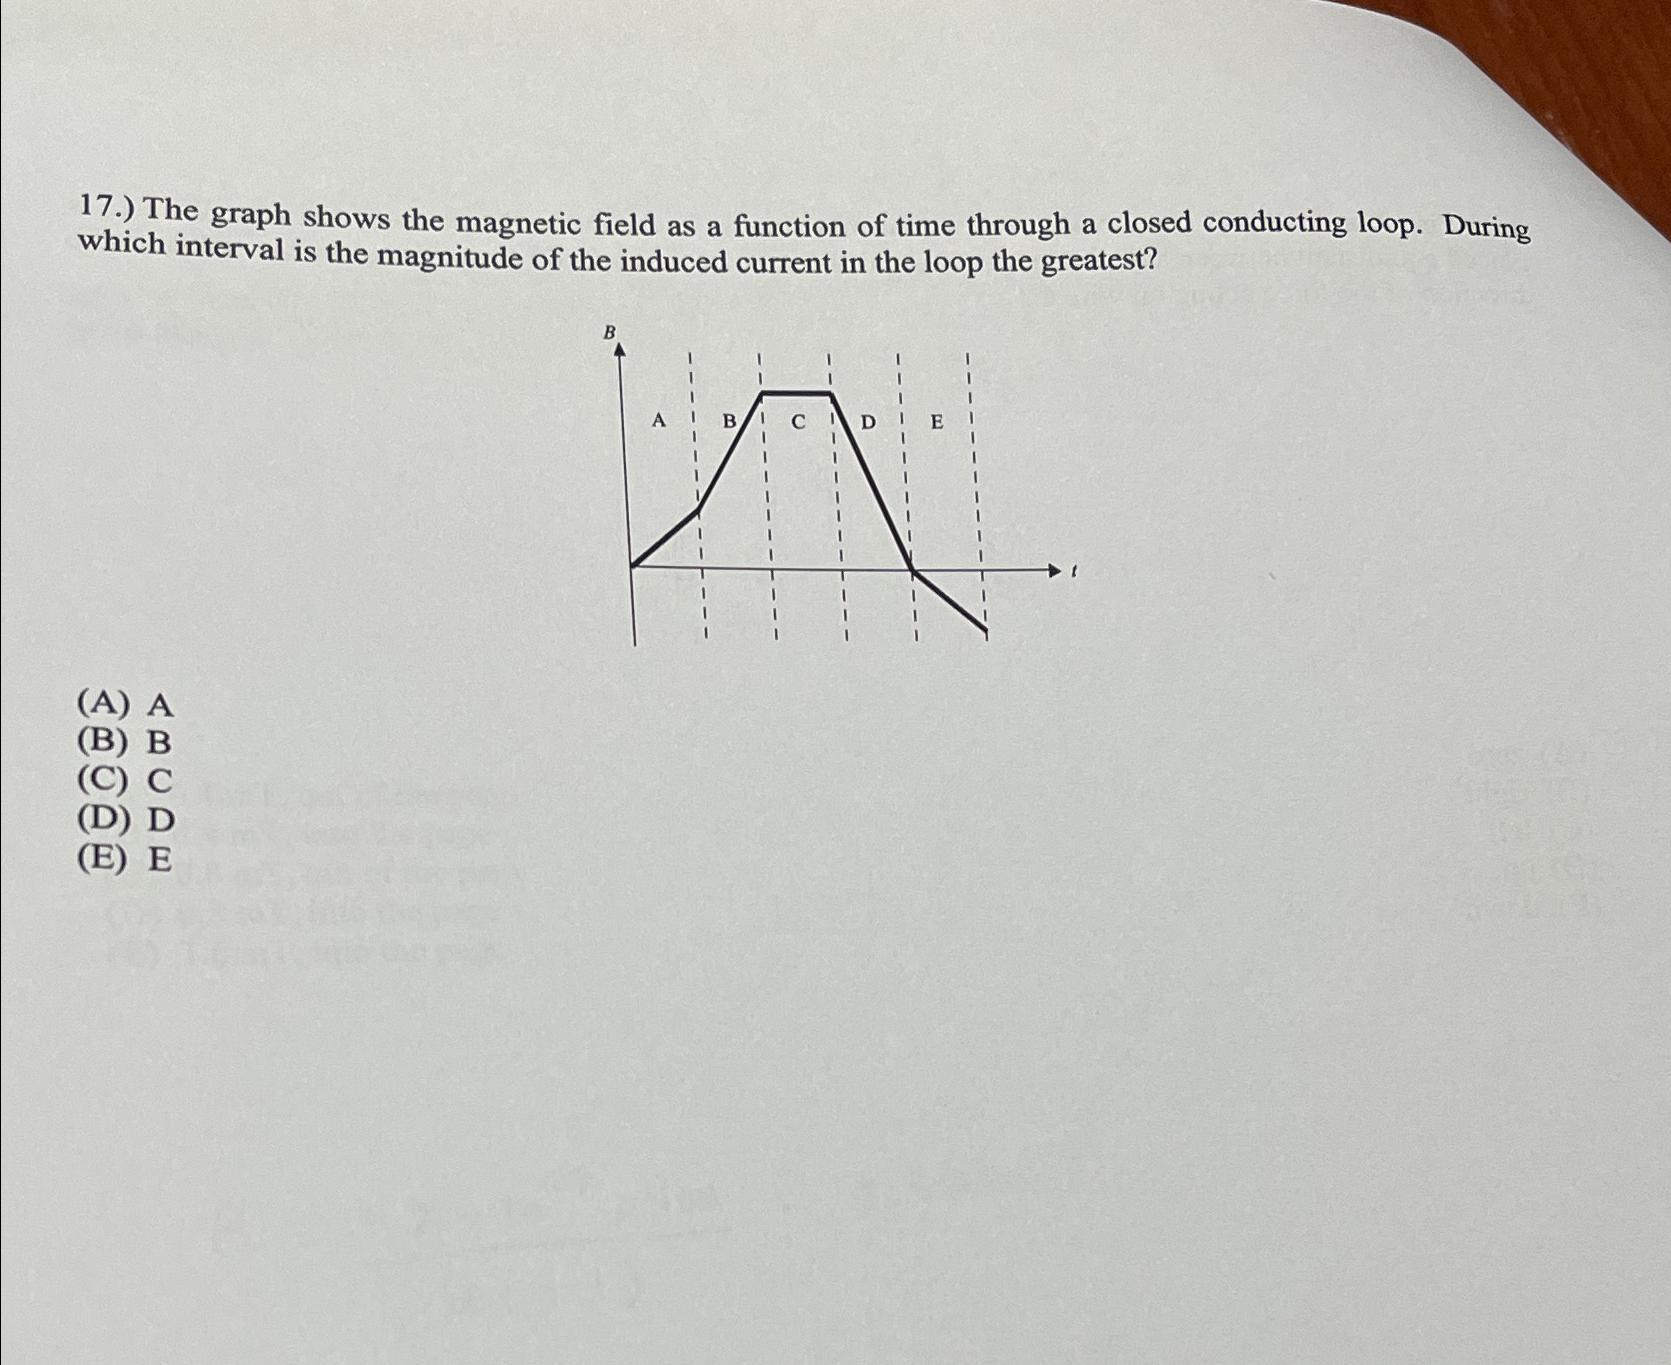
17.) The graph shows the magnetic field as a function of time through a closed conducting loop. During which interval is the magnitude of the induced current in the loop the greatest? (E) E 30000 B A B T C D E n 17.) The graph shows the magnetic field as a function of time through a closed conducting loop. During which interval is the magnitude of the induced current in the loop the greatest? (E) E 30000 B A B T C D E n
Step by Step Solution
3.48 Rating (155 Votes )
There are 3 Steps involved in it
The detailed answer for the above question is provided below The question refers to the phenomenon described by Faradays law of electromagnetic induct... View full answer

Get step-by-step solutions from verified subject matter experts