

Question: 17th question. 17. Based on the table below y1 Probability-T-Bills-1-HighTechTCollections.ps.Rubber! Market State of Econom Recession Average Boom 1-2290 0.2 0.6 0.2 890 8% 8% 8%
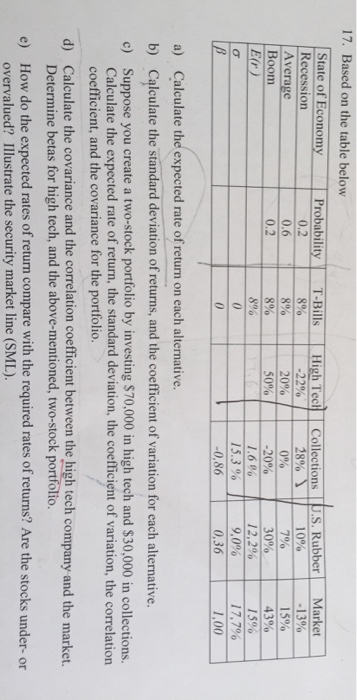
17. Based on the table below y1 Probability-T-Bills-1-HighTechTCollections.ps.Rubber! Market State of Econom Recession Average Boom 1-2290 0.2 0.6 0.2 890 8% 8% 8% 28%)11 10% 0% 1 3% 1 5% 20% 50%11-20% 1.6% 3000 | 43% 12,2% | I 50.0 17,7% 1,00 15.3% 0,86 0,36 a) b) c) Calculate the expected rate of return on each alternative. Calculate the standard deviation of returns, and the coefficient of variation for each alternative. Suppose you create a two-stock portfolio by investing $70,000 in high tech and $30,000 in collections. Calculate the expected rate of return, the standard deviation, the coefficient of variation, the correlation coefficient, and the covariance for the portfolio. Calculate the covariance and the correlation coefficient between the high tech company and the market. Determine betas for high tech, and the above-mentioned, two-stock portfolio. d) e) How do the expected rates of return compare with the required rates of returns? Are the stocks under- or overvalued? Illustrate the security market line (SML)
Step by Step Solution
There are 3 Steps involved in it

Get step-by-step solutions from verified subject matter experts