

Question: 18. Concerning the data in 2016 GSS, the standard normal table reports the following information in the table below. Calculate the proportion of respondents who
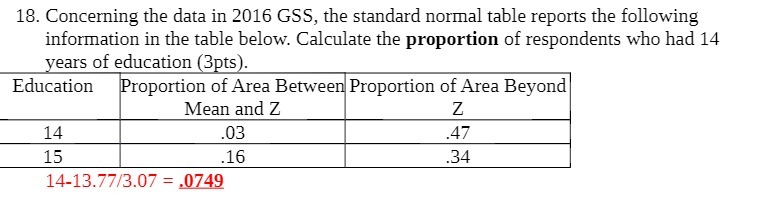
18. Concerning the data in 2016 GSS, the standard normal table reports the following information in the table below. Calculate the proportion of respondents who had 14 years of education (3pts). Education Proportion of Area Between Proportion of Area Beyond Mean and Z Z 14 .03 47 15 16 34 14-13.77/3.07 = .0749
Step by Step Solution
There are 3 Steps involved in it
1 Expert Approved Answer
Step: 1 Unlock

Question Has Been Solved by an Expert!
Get step-by-step solutions from verified subject matter experts
Step: 2 Unlock
Step: 3 Unlock