

Question: 18. Past data has shown that the regression line relating the final exam score and the midterm exam score for students who take statistics from
18. Past data has shown that the regression line relating the final exam score and the midterm
exam score for students who take statistics from a certain professor is:
final exam = 50 + 0.5 midterm
One interpretation of the slope is
a. a student who scored 0 on the midterm would be predicted to score 50 on the final exam.
b. a student who scored 0 on the final exam would be predicted to score 50 on the midterm
exam.
c. a student who scored 10 points higher than another student on the midterm would be
predicted to score 5 points higher than the other student on the final exam.
d. students only receive half as much credit (.5) for a correct answer on the final exam
compared to a correct answer on the midterm exam.
Questions 19 to 21: A survey asked people how often they exceed speed limits. The data are
then categorized into the following contingency table of counts showing the relationship between
age group and response.
Exceed Limit if Possible?
Age Always Not Always Total
Under 30 100 100 200
Over 30 40 160 200
Total 140 260 400
19. Among people with age over 30, what's the "risk" of always exceeding the speed limit?
a. 0.20
b. 0.40
c. 0.33
d. 0.50
20. Among people with age under 30 what are the odds that they always exceed the speed limit?
a. 1 to 2
b. 2 to 1
c. 1 to 1
d. 50%
21. What is the relative risk of always exceeding the speed limit for people under 30 compared to
people over 30?
a. 2.5
b. 0.4
c. 0.5
d. 30%
A polling agency conducted a survey of 100 doctors on the question "Are you willing to treat
women patients with the recently approved pill RU-486"? The conservative margin of error
associated with the 95% confidence interval for the percent who say 'yes' is
a. 50% b. 10% c. 5% d. 2%
11. Which one of these statistics is unaffected by outliers?
a. Mean
b. Interquartile range
c. Standard deviation
d. Range
12. A list of 5 pulse rates is: 70, 64, 80, 74, 92. What is the median for this list?
a. 74 b. 76 c. 77 d. 80
13. Which of the following would indicate that a dataset is not bell-shaped?
a. The range is equal to 5 standard deviations.
b. The range is larger than the interquartile range.
c. The mean is much smaller than the median.
d. There are no outliers.
14. A scatter plot of number of teachers and number of people with college degrees for cities in
California reveals a positive association. The most likely explanation for this positive
association is:
a. Teachers encourage people to get college degrees, so an increase in the number of
teachers is causing an increase in the number of people with college degrees.
b. Larger cities tend to have both more teachers and more people with college degrees, so
the association is explained by a third variable, the size of the city.
c. Teaching is a common profession for people with college degrees, so an increase in the
number of people with college degrees causes an increase in the number of teachers.
d. Cities with higher incomes tend to have more teachers and more people going to college,
so income is a confounding variable, making causation between number of teachers and
number of people with college degrees difficult to prove.
15. The value of a correlation is reported by a researcher to be r = ?0.5. Which of the following
statements is correct?
a. The x-variable explains 25% of the variability in the y-variable.
b. The x-variable explains ?25% of the variability in the y-variable.
c. The x-variable explains 50% of the variability in the y-variable.
d. The x-variable explains ?50% of the variability in the y-variable.
16. What is the effect of an outlier on the value of a correlation coefficient?
a. An outlier will always decrease a correlation coefficient.
b. An outlier will always increase a c
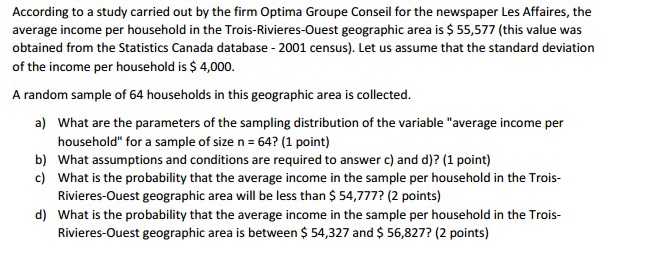
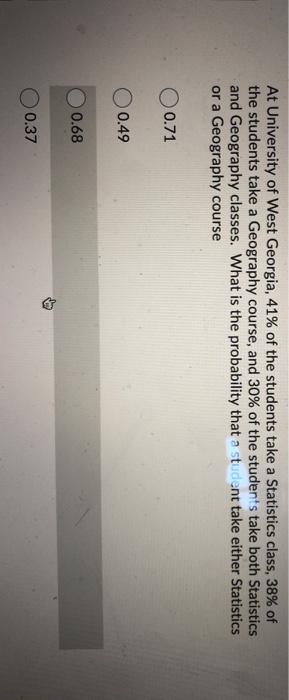
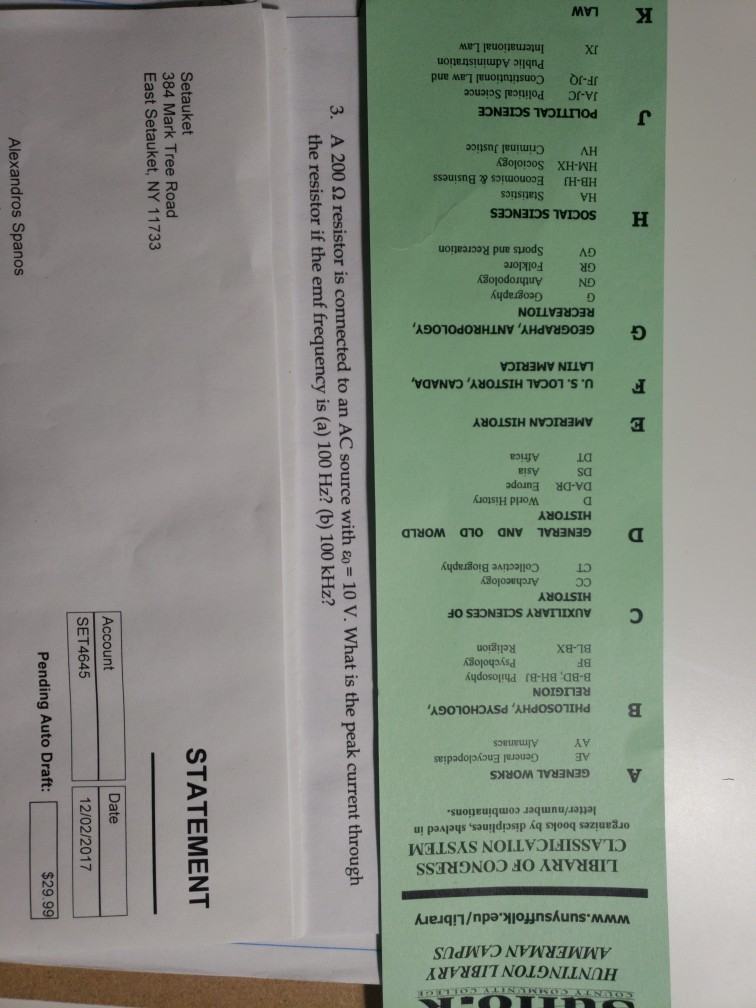
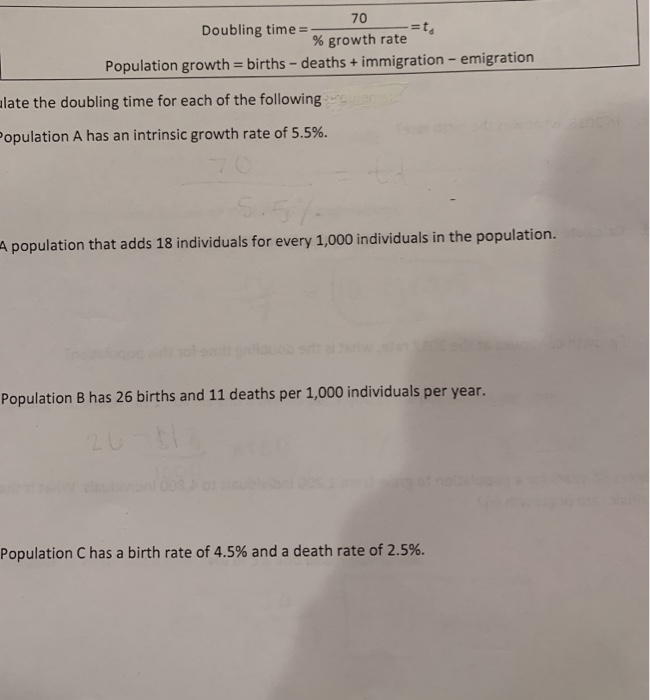
According to a study carried out by the firm Optima Groupe Conseil for the newspaper Les Affaires, the average income per household in the Trois-Rivieres-Quest geographic area is $ 55,577 (this value was obtained from the Statistics Canada database - 2001 census). Let us assume that the standard deviation of the income per household is $ 4,000. A random sample of 64 households in this geographic area is collected. a) What are the parameters of the sampling distribution of the variable "average income per household" for a sample of size n = 64? (1 point) b) What assumptions and conditions are required to answer c) and d)? (1 point) c) What is the probability that the average income in the sample per household in the Trois- Rivieres-Quest geographic area will be less than $ 54,777? (2 points) d) What is the probability that the average income in the sample per household in the Trois- Rivieres-Quest geographic area is between $ 54,327 and $ 56,827? (2 points)At University of West Georgia, 41% of the students take a Statistics class, 38% of the students take a Geography course, and 30% of the students take both Statistics and Geography classes. What is the probability that a student take either Statistics or a Geography course 0.71 0.49 0.68 0.37COUNTY COMMUNITY COLLEGE HUNTINGTON LIBRARY AMMERMAN CAMPUS www.sunysuffolk.edu/Library $29.99 LIBRARY OF CONGRESS CLASSIFICATION SYSTEM 12/02/2017 organizes books by disciplines, shelved in STATEMENT letterumber combinations. Date A GENERAL WORKS AE General Encyclopedias AY Almanacs Pending Auto Draft: B PHILOSOPHY, PSYCHOLOGY, RELIGION B-BD; BH-BJ Philosophy BF Psychology BL-BX SET4645 Religion Account AUXILIARY SCIENCES OF HISTORY CC Archaeology CT Collective Biography D GENERAL AND OLD WORLD HISTORY D World History 3. A 200 $2 resistor is connected to an AC source with go = 10 V. What is the peak current through DA-DR Europe DS Asia DT Africa E AMERICAN HISTORY F U. S. LOCAL HISTORY, CANADA, the resistor if the emf frequency is (a) 100 Hz? (b) 100 kHz? LATIN AMERICA G GEOGRAPHY, ANTHROPOLOGY, RECREATION G Geography GN Anthropology GR Folklore GV Sports and Recreation H SOCIAL SCIENCES Alexandros Spanos HA Statistics HB-HJ Economics & Business HM-HX Sociology East Setauket, NY 11733 HV Criminal Justice 384 Mark Tree Road J POLITICAL SCIENCE Setauket JA-JC Political Science JF-JQ Constitutional Law and Public Administration JX International Law K LAW70 Doubling time =- % growth rate Population growth = births - deaths + immigration - emigration late the doubling time for each of the following cher opulation A has an intrinsic growth rate of 5.5%. 70 5. 5/ A population that adds 18 individuals for every 1,000 individuals in the population. Population B has 26 births and 11 deaths per 1,000 individuals per year. 26-61 Population C has a birth rate of 4.5% and a death rate of 2.5%
Step by Step Solution
There are 3 Steps involved in it

Get step-by-step solutions from verified subject matter experts