Question: 18. The components that makes up a typical time series are: 20. The time series demand pattern that is shown in the diagram is: A.
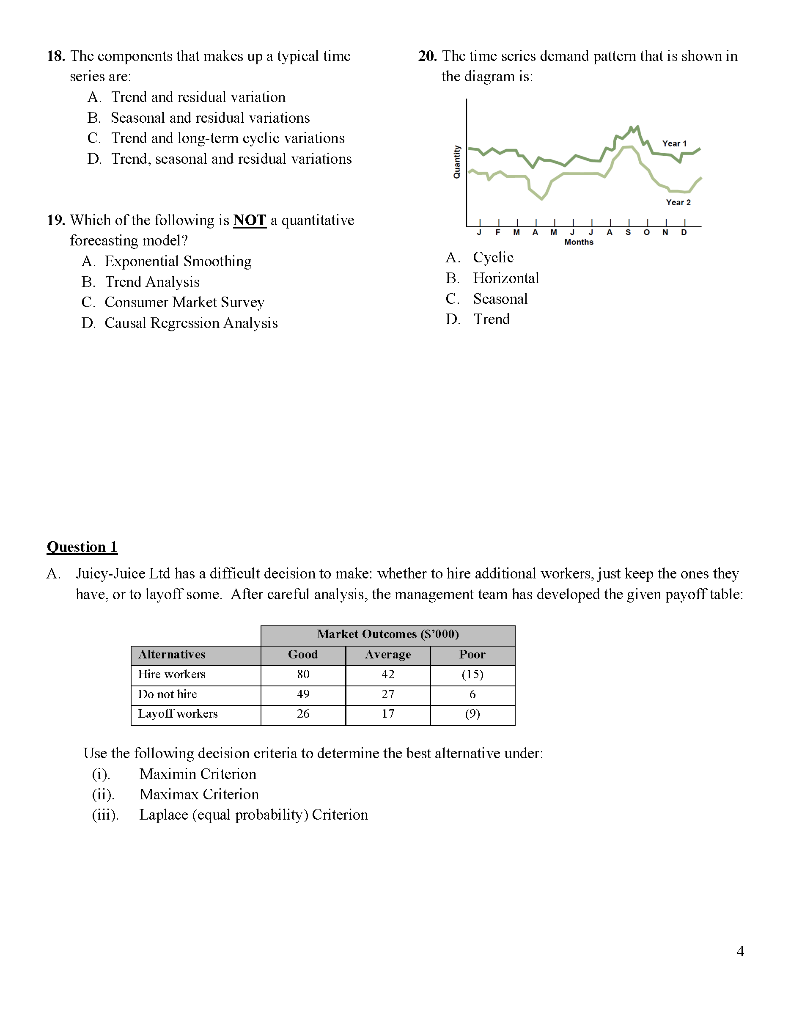
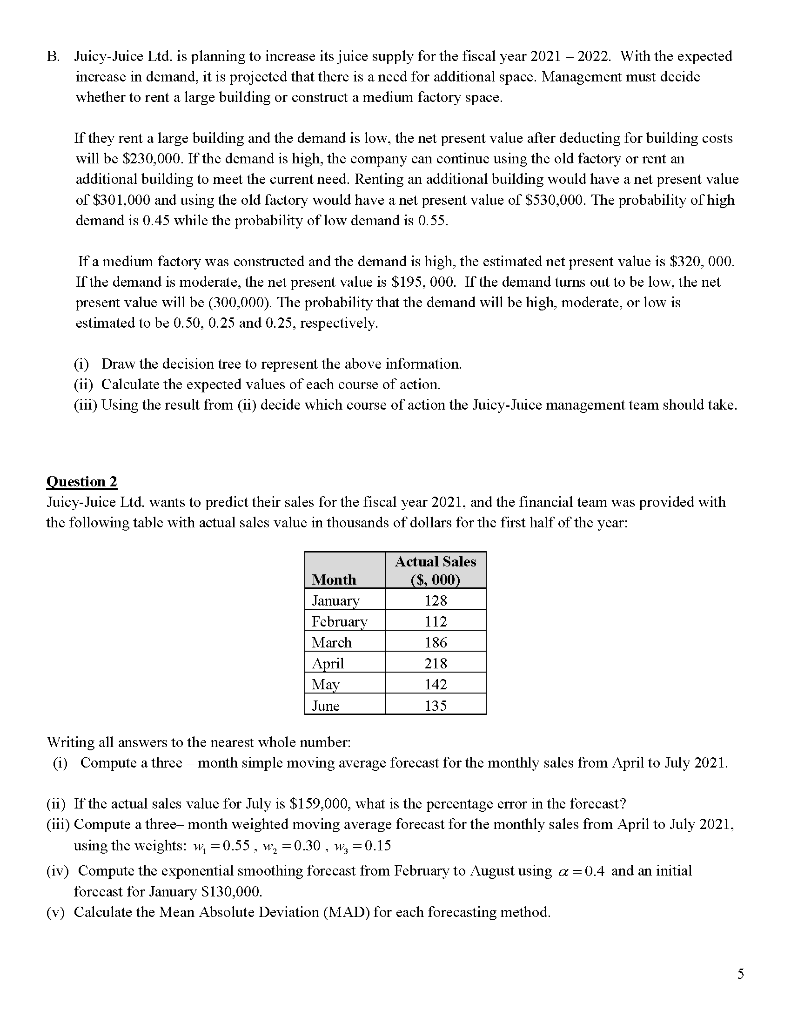
18. The components that makes up a typical time series are: 20. The time series demand pattern that is shown in the diagram is: A. Trend and residual variation B Seasonal and residual variations C. Trend and long-term cyclic variations D. Trend, seasonal and residual variations Year 1 Year 2 A son1 Months 19. Which of the following is NOT a quantitative forecasting model? A. Exponential Smoothing B. Trend Analysis C. Consumer Market Survey D. Causal Regression Analysis A. Cyclic B. Horizontal C. Scasonal D. Trend Question 1 A. Juicy-Juice Ltd has a difficult decision to make: whether to hire additional workers, just keep the ones they have, or to layoff some. After careful analysis, the management team has developed the given payoff table: Market Outcomes (S'000) Good Average Poor 80 42 (15) Alternatives Hire workers Do not hire Layoll workers 49 6 27 17 26 (9) Use the following decision criteria to determine the best alternative under: (1). Maxinin Criterion (ii) Maximax Criterion (iii). Laplace (equal probability) Criterion 4 B. Juicy-Juice Ltd. is planning to increase its juice supply for the fiscal year 2021 2022. With the expected increase in demand, it is projected that there is a need for additional space. Management must decide whether to rent large building or construct a medium factory space. If they rent a large building and the demand is low, the net present value after deducting for building costs will be $230,000. It the demand is high, the company can continue using the old factory or rent an additional building to meet the current need. Renting an additional building would have a net present value of $301,000 and using the old factory would have a net present value of $530,000. The probability of high demand is 0.45 while the probability of low demand is 0.55. If a medium factory was constructed and the demand is high, the estimated net present value is $320,000. If the demand is moderate, the nel present value is $195, 000. If the demand turns out to be low, the net present value will be (300,000). The probability that the demand will be high, moderate, or low is estimated to be 0.50, 0.25 and 0.25, respectively. (1) Draw the decision tree to represent the above information. (ii) Calculate the expected values of each course of action. (111) Using the result from (ii) decide which course of action the Juicy-Juice management team should take. Question 2 Juicy-Juice Ltd. wants to predict their sales for the fiscal year 2021. and the financial team was provided with the following table with actual sales value in thousands of dollars for the first half of the year: Month January February March April May June Actual Sales ($, 000) 128 112 186 218 142 135 Writing all answers to the nearest whole number: (1) Compute a three month simple moving average forecast for the monthly sales from April to July 2021. (ii) If the actual sales value for July is $159,000, what is the percentage error in the forecast? (iii) Compute a three-month weighted moving average forecast for the monthly sales from April to July 2021, using the weights: wi =0.55, W, =0.30, Win=0.15 (iv) Compute the exponential smoothing forecast from February to August using a =0.4 and an initial forecast for January S130,000. (v) Calculate the Mean Absolute Deviation (MAD) for each forecasting method


