

Question: 18 Vertical Analysis Using the folowing operating data for Melmel Corporation, completetheincome statement below showing a vertical analysis for Net sales $350,000 $320,000 Cost of
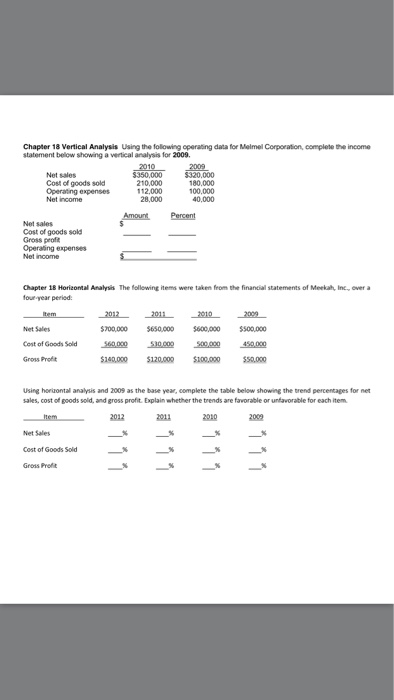

18 Vertical Analysis Using the folowing operating data for Melmel Corporation, completetheincome statement below showing a vertical analysis for Net sales $350,000 $320,000 Cost of goods sold 210.000 180,000 Operating expenses 112.000 100,000 Net income 28,000 40,000 Net sales Cost of goods sold Gross profit Operating expenses Chapter 18 Horizontal Analysis The following items were taken from the financial statements of Meriah, Inc. over a four year period: 2012 -201L -2010 Net Sales $200.000 Cost of Goods Sold Gross Profit Using horizontal analysis and 2009 as the base year, complete the table below showing the trend percentages for net sales, cost of goods sold and gross profit Explain whether the trends are favorable or unfavorable for each item them Net Sales
Step by Step Solution
There are 3 Steps involved in it

Get step-by-step solutions from verified subject matter experts