

Question: 18. Which statement is false? A The sampling distribution is the distribution of the values of a sample statistic computed for each possible sample that
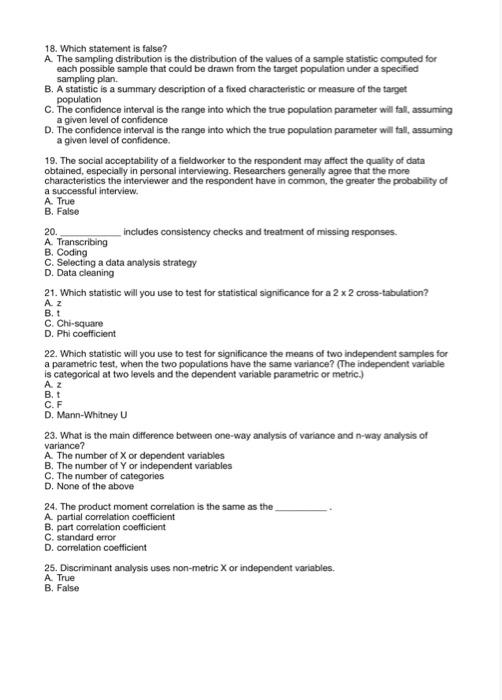
18. Which statement is false? A The sampling distribution is the distribution of the values of a sample statistic computed for each possible sample that could be drawn from the target population under a specified sampling plan. B. A statistic is a summary description of a fixed characteristic or measure of the target C. The confidence interval is the range into which the true population parameter will fal, assuming D. The confidence interval is the range into which the true population parameter will tall, assuming a given level of confidence. population a given level of confidence 19. The social acceptability of a fieldworker to the respondent may affect the quality of data obtained, especially in personal interviewing. Researchers generally agree that the more characteristics the interviewer and the respondent have in common, the greater the probability of a successful interview. A True B. False 20. includes consistency checks and treatment of missing responses. A Transcribing B. Coding C. Selecting a data analysis strategy D. Data cleaning 21. Which statistic will you use to test for statistical significance for a 2 x 2 cross-tabulation? Az B. C. Chi-square D. Phi coutficiant 22. Which statistic will you use to test for significance the means of two independent samples for a parametric test, when the two populations have the same variance? (The independent variable is categorical at two levels and the dependent variable parametric or metric.) AZ B. C.F D. Mann-Whitney U 23. What is the main difference between one-way analysis of variance and n-way analysis of A. The number of X or dependent variables B. The number of Y or independent variables variance? C. The number of categories D. None of the above 24. The product moment correlation is the same as the A partial correlation coefficient B. part correlation coefficient C. standard error D. correlation coefficient 25. Discriminant analysis uses non-metric X or independent variables. A True B. False
Step by Step Solution
There are 3 Steps involved in it

Get step-by-step solutions from verified subject matter experts