

Question: 185 Problem 5 (10 points) Analyzing a mixed cost using regression data Bordahl documented their production levels and overhead costs for the past six months.
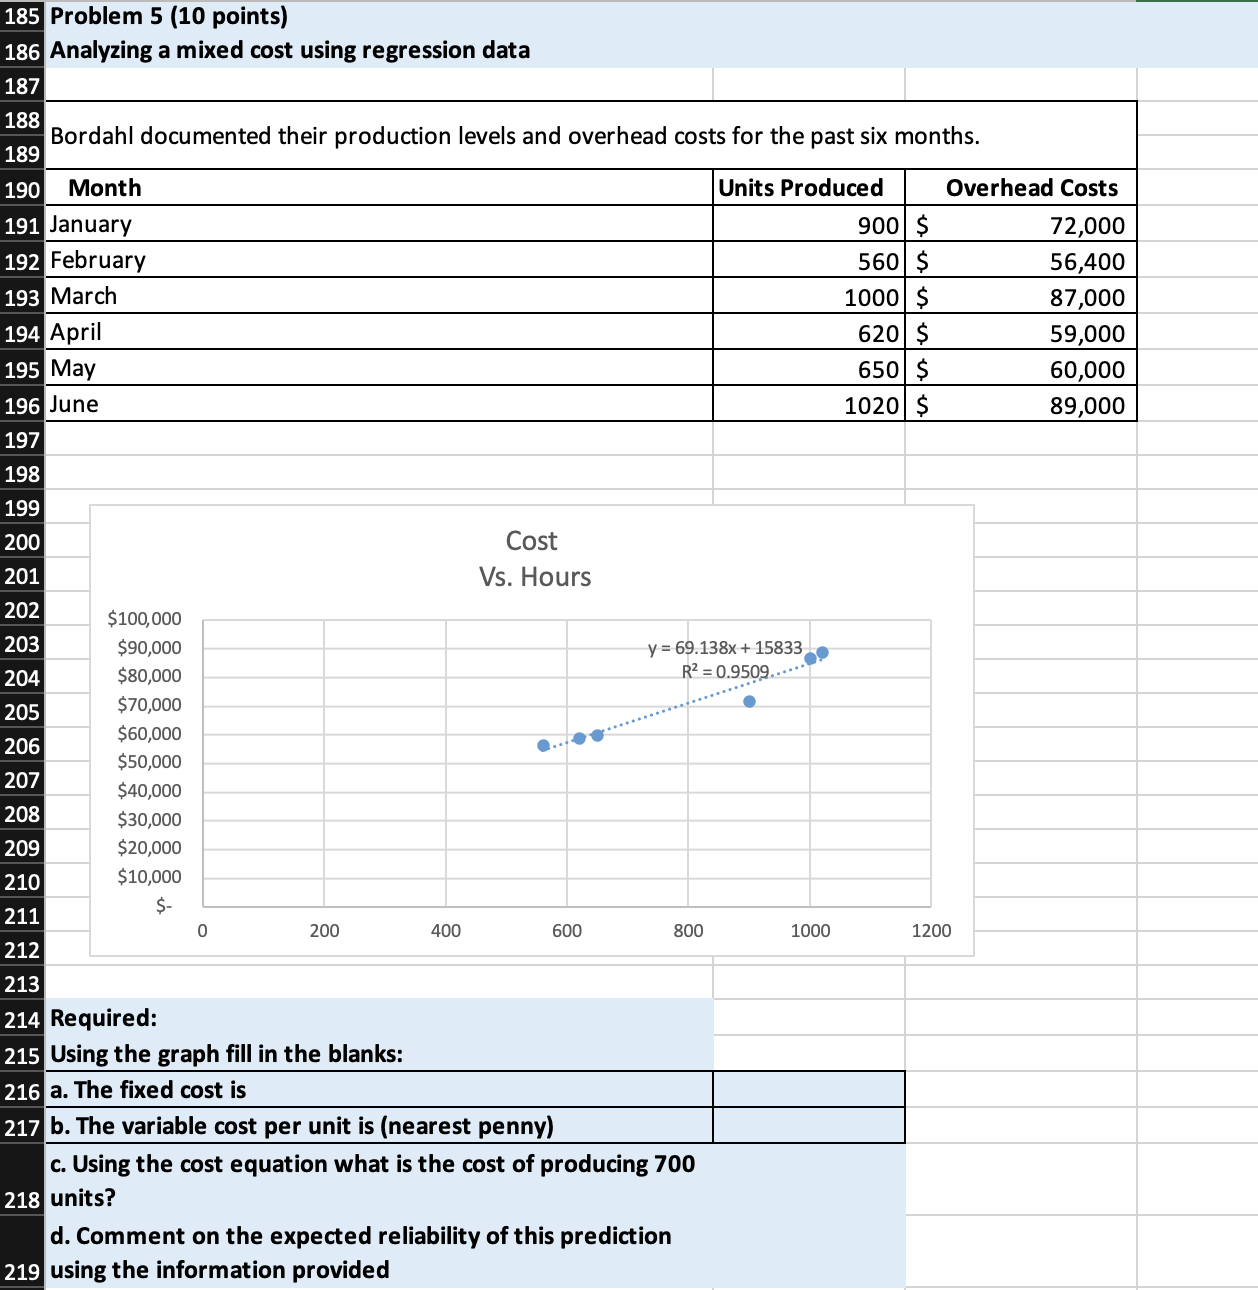
185 Problem 5 (10 points) Analyzing a mixed cost using regression data Bordahl documented their production levels and overhead costs for the past six months. \begin{tabular}{|l|r|rr|} \hline Month & Units Produced & \multicolumn{1}{|c|}{ Overhead Costs } \\ \hline January & 900 & $ & 72,000 \\ \hline February & 560 & $ & 56,400 \\ \hline March & 1000 & $ & 87,000 \\ \hline April & 620 & $ & 59,000 \\ \hline May & 650 & $ & 60,000 \\ \hline June & 1020 & $ & 89,000 \\ \hline \end{tabular} Cost Vs. Hours $100,000 $90,000 $80,000 $70,000 $60,000 $50,000 $40,000 $30,000 $20,000 $10,000 \$- 214 Required: 215 Using the graph fill in the blanks: 216 a. The fixed cost is 217 b. The variable cost per unit is (nearest penny) c. Using the cost equation what is the cost of producing 700 218 units? d. Comment on the expected reliability of this prediction 219 using the information provided
Step by Step Solution
There are 3 Steps involved in it

Get step-by-step solutions from verified subject matter experts