

Question: 1 2 1 point Above, we have six scatter plots that show the relationship between two variables. Based on the plots above, which of
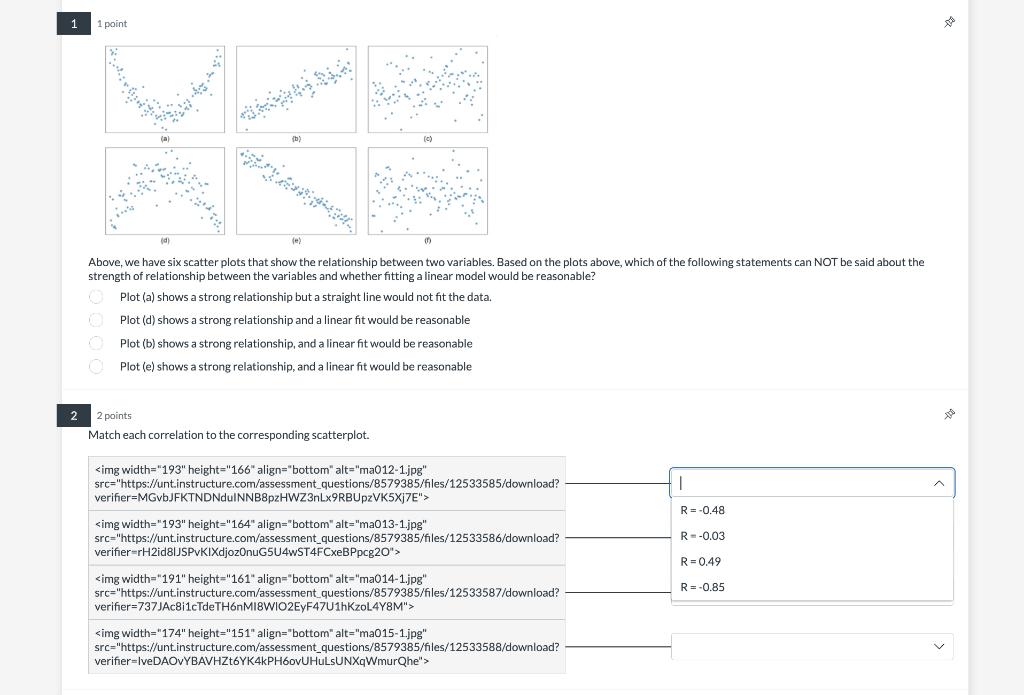
1 2 1 point Above, we have six scatter plots that show the relationship between two variables. Based on the plots above, which of the following statements can NOT be said about the strength of relationship between the variables and whether fitting a linear model would be reasonable? Plot (a) shows a strong relationship but a straight line would not fit the data. Plot (d) shows a strong relationship and a linear fit would be reasonable Plot (b) shows a strong relationship, and a linear fit would be reasonable Plot (e) shows a strong relationship, and a linear fit would be reasonable C O 2 points Match each correlation to the corresponding scatterplot. I R= -0.48 R=-0.03 R = 0.49 R=-0,85 De
Step by Step Solution
3.46 Rating (149 Votes )
There are 3 Steps involved in it
The second option is correct Ie option 2 Is Not be said about the strength of relatio... View full answer

Get step-by-step solutions from verified subject matter experts