

Question: 19 78 This assignment is a more advanced version of the Simple Company Model developed in Developing a Model (Workbook 7) to implement various hypothesis
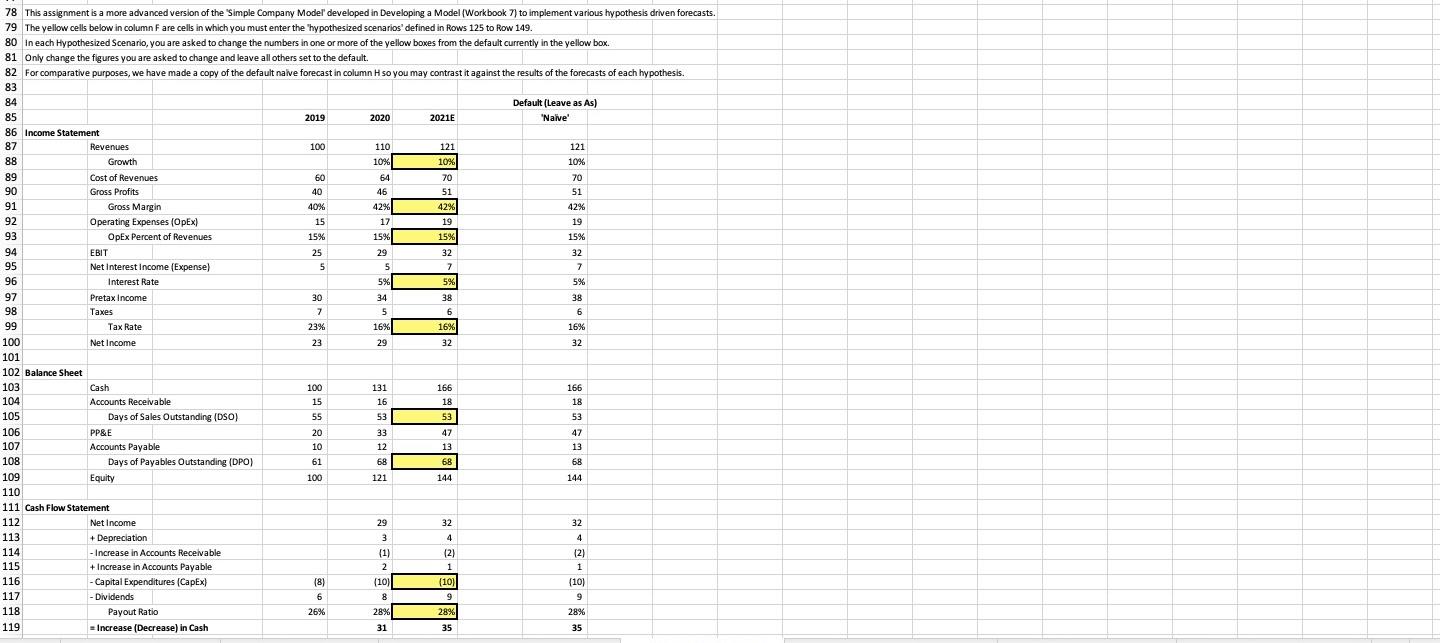
19 78 This assignment is a more advanced version of the Simple Company Model developed in Developing a Model (Workbook 7) to implement various hypothesis driven forecasts. 79 The yellow cells below in column F are cells in which you must enter the "hypothesized scenarios' defined in Rows 125 to Row 149. 80 ineach Hypothesized Scenario, you are asked to change the numbers in one or more of the yellow boxes from the default currently in the yellow box. 81 Only change the figures you are asked to change and leave all others set to the default. 82 For comparative purposes, we have made a copy of the default naive forecast in column H so you may contrast it against the results of the forecasts of each hypothesis. 83 84 Default (Leave as As) 85 2019 2020 2021E "Nalive 86 Income Statement 87 Revenues 100 110 121 121 88 Growth 10% 10% 10% 89 Cost of Revenues 60 64 70 70 90 Gross Profits 40 46 51 51 91 Gross Margin 40% 42% 42% 42% 92 Operating Expenses (Opex) 15 17 19 93 OpEx Percent of Revenues 15% 15% 15% 15% 94 EBIT 25 29 32 32 95 Net Interest Income (Expense) 5 5 7 7 96 Interest Rate 5% 5% 5% 97 Pretax income 30 34 38 38 98 Taxes 7 5 6 6 6 99 Tax Rate 23% 16% 16% 16% 100 Net Income 23 29 32 32 101 102 Balance Sheet 103 Cash 100 131 166 166 104 Accounts Receivable 15 16 18 18 105 Days of Sales Outstanding (DSO) 55 53 53 53 106 PP&E 20 33 47 47 107 Accounts Payable 10 12 13 13 108 Days of Payables Outstanding (DPO) 61 68 68 6B 109 Equity 100 121 144 144 110 111 Cash Flow Statement 112 Net Income 29 32 32 113 + Depreciation 3 4 4 114 Increase in Accounts Receivable (1) (2) (2) 115 + Increase in Accounts Payable 2 2 1 1 116 -Capital Expenditures (Capex) (8) (10) (10) (10) 117 Dividends 6 8 9 9 118 Payout Ratio 26% 28% 2892 28% 119 = Increase (Decrease) in Cash 31 35 35 **00 19 78 This assignment is a more advanced version of the Simple Company Model developed in Developing a Model (Workbook 7) to implement various hypothesis driven forecasts. 79 The yellow cells below in column F are cells in which you must enter the "hypothesized scenarios' defined in Rows 125 to Row 149. 80 ineach Hypothesized Scenario, you are asked to change the numbers in one or more of the yellow boxes from the default currently in the yellow box. 81 Only change the figures you are asked to change and leave all others set to the default. 82 For comparative purposes, we have made a copy of the default naive forecast in column H so you may contrast it against the results of the forecasts of each hypothesis. 83 84 Default (Leave as As) 85 2019 2020 2021E "Nalive 86 Income Statement 87 Revenues 100 110 121 121 88 Growth 10% 10% 10% 89 Cost of Revenues 60 64 70 70 90 Gross Profits 40 46 51 51 91 Gross Margin 40% 42% 42% 42% 92 Operating Expenses (Opex) 15 17 19 93 OpEx Percent of Revenues 15% 15% 15% 15% 94 EBIT 25 29 32 32 95 Net Interest Income (Expense) 5 5 7 7 96 Interest Rate 5% 5% 5% 97 Pretax income 30 34 38 38 98 Taxes 7 5 6 6 6 99 Tax Rate 23% 16% 16% 16% 100 Net Income 23 29 32 32 101 102 Balance Sheet 103 Cash 100 131 166 166 104 Accounts Receivable 15 16 18 18 105 Days of Sales Outstanding (DSO) 55 53 53 53 106 PP&E 20 33 47 47 107 Accounts Payable 10 12 13 13 108 Days of Payables Outstanding (DPO) 61 68 68 6B 109 Equity 100 121 144 144 110 111 Cash Flow Statement 112 Net Income 29 32 32 113 + Depreciation 3 4 4 114 Increase in Accounts Receivable (1) (2) (2) 115 + Increase in Accounts Payable 2 2 1 1 116 -Capital Expenditures (Capex) (8) (10) (10) (10) 117 Dividends 6 8 9 9 118 Payout Ratio 26% 28% 2892 28% 119 = Increase (Decrease) in Cash 31 35 35 **00
Step by Step Solution
There are 3 Steps involved in it

Get step-by-step solutions from verified subject matter experts