

Question: 19. A demand planner used the historical data from year 2022 shown in the table below to introduce a forecasting model. After plotting the data,
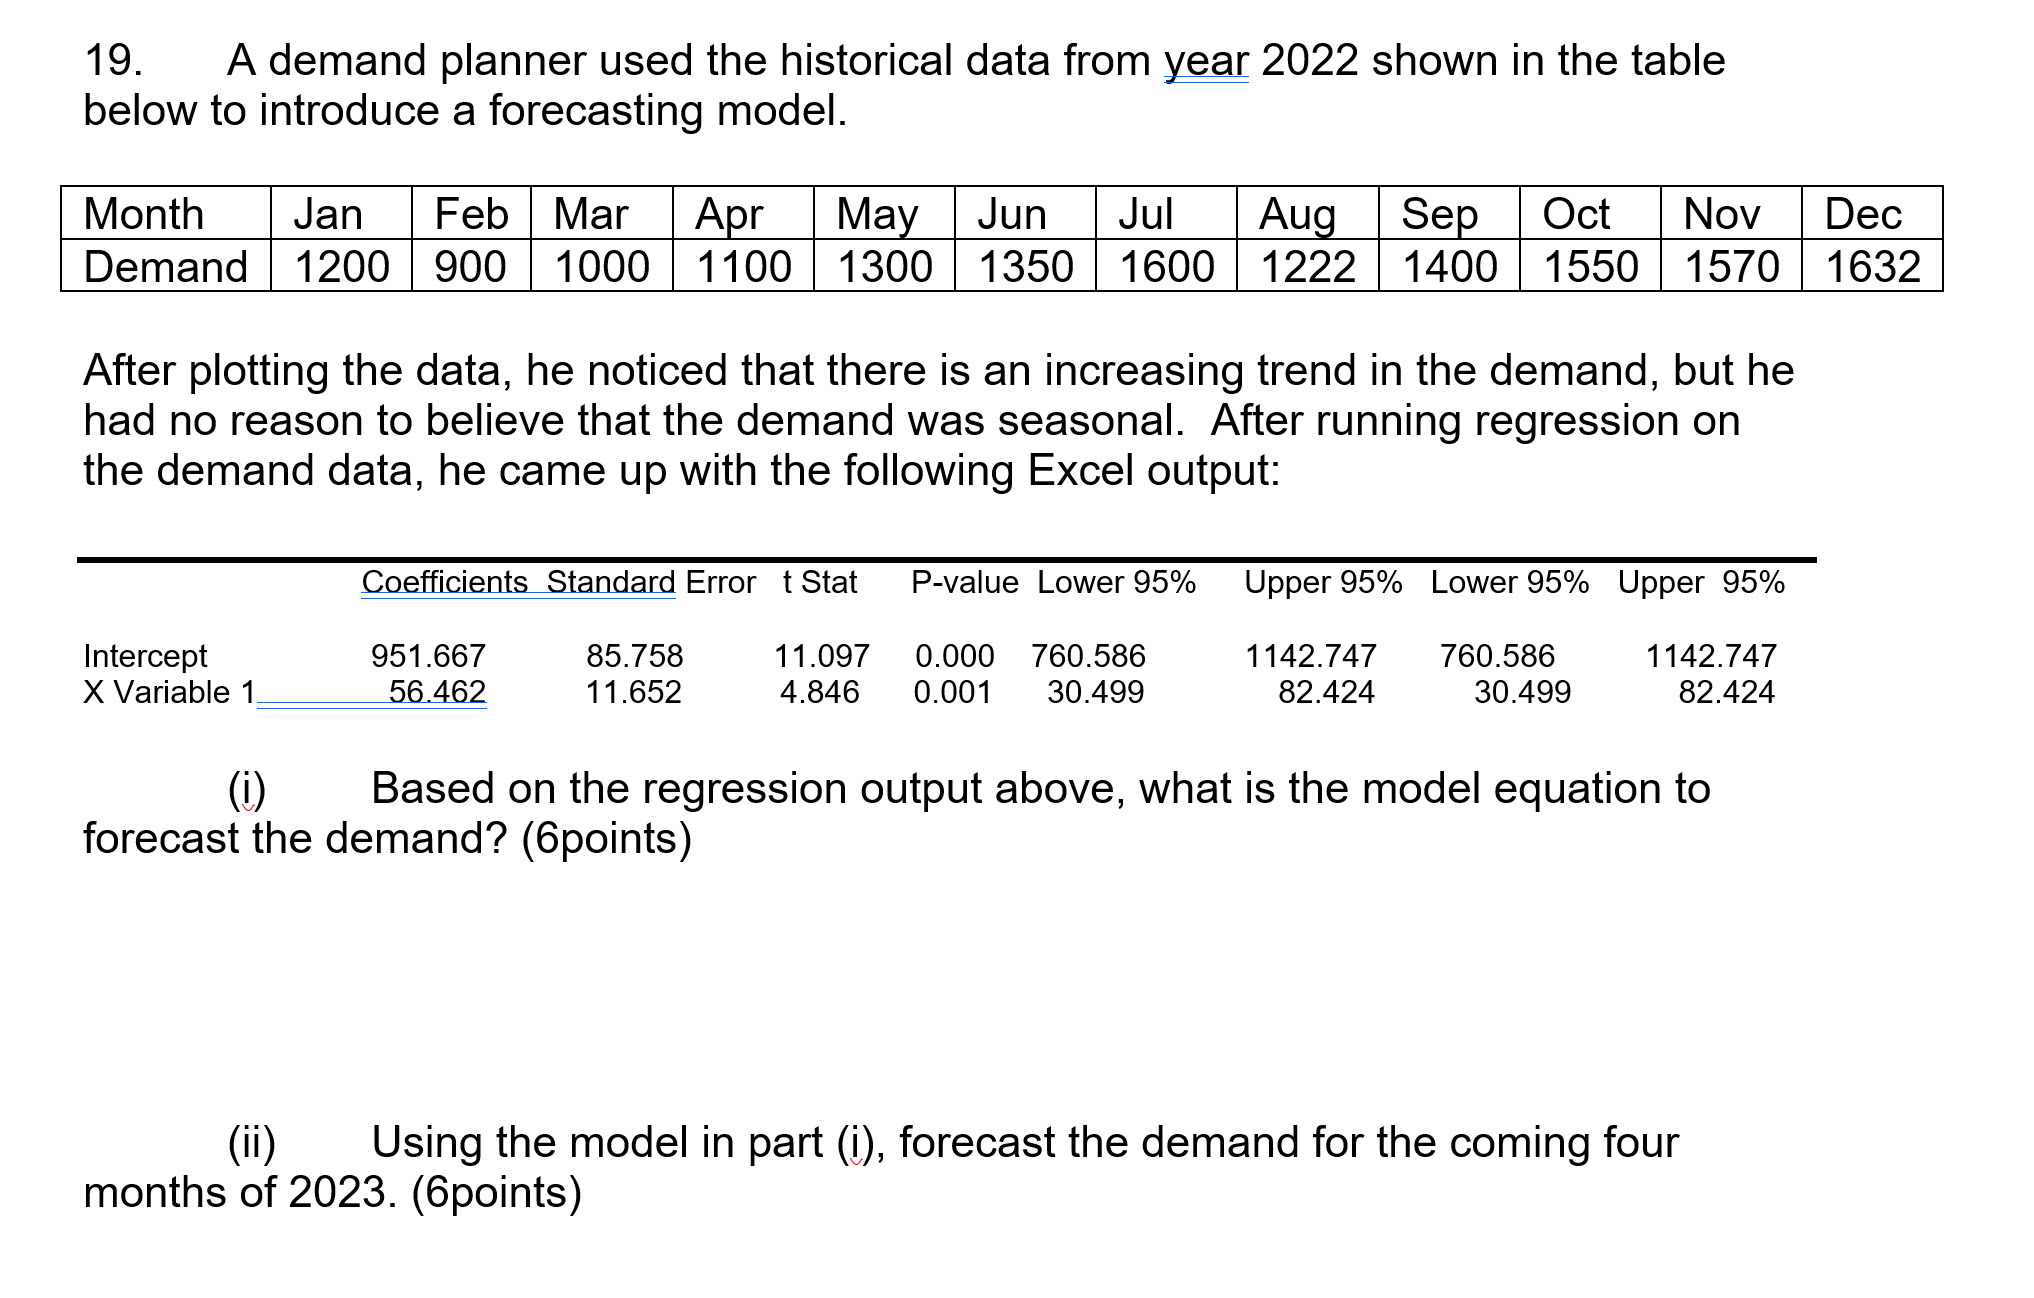
19. A demand planner used the historical data from year 2022 shown in the table below to introduce a forecasting model. After plotting the data, he noticed that there is an increasing trend in the demand, but he had no reason to believe that the demand was seasonal. After running regression on the demand data, he came up with the following Excel output: % .7 4 (i) Based on the regression output above, what is the model equation to forecast the demand? (6points) (ii) Using the model in part (i), forecast the demand for the coming four months of 2023. (6points)
Step by Step Solution
There are 3 Steps involved in it
1 Expert Approved Answer
Step: 1 Unlock

Question Has Been Solved by an Expert!
Get step-by-step solutions from verified subject matter experts
Step: 2 Unlock
Step: 3 Unlock