

Question: 19. According to statistical data, the rodent population, , in a certain region varies sinusoidally and can be modeled by the function r(t) = 300
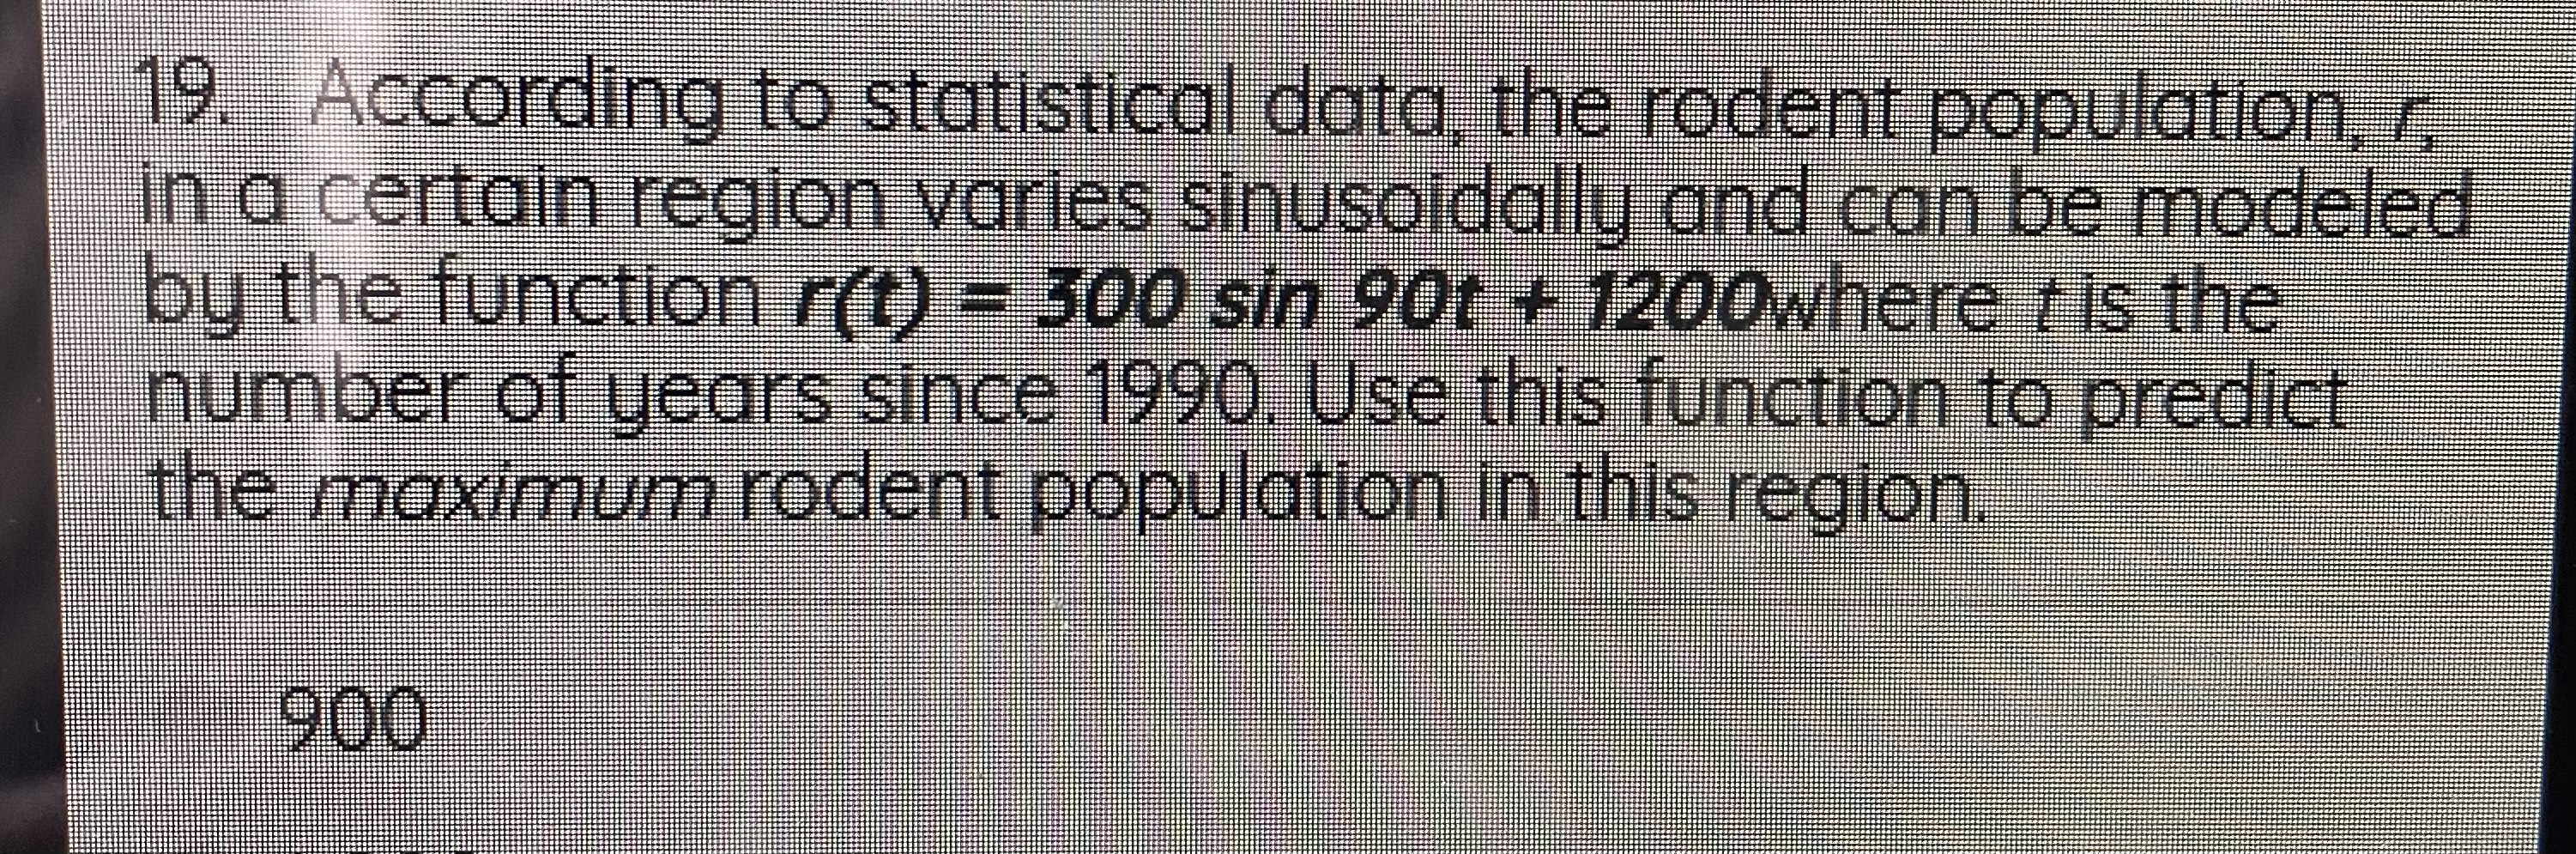


19. According to statistical data, the rodent population, , in a certain region varies sinusoidally and can be modeled by the function r(t) = 300 sin 90t + 1200where t is the number of years since 1990. Use this function to predict the maximum rodent population in this region. 900\fIf cos 8 = for0' _ 0
Step by Step Solution
There are 3 Steps involved in it
1 Expert Approved Answer
Step: 1 Unlock

Question Has Been Solved by an Expert!
Get step-by-step solutions from verified subject matter experts
Step: 2 Unlock
Step: 3 Unlock