

Question: 19. In a given table, the average stock returns for a portfolio are stored for various quarters. Create a chart for this data and answer
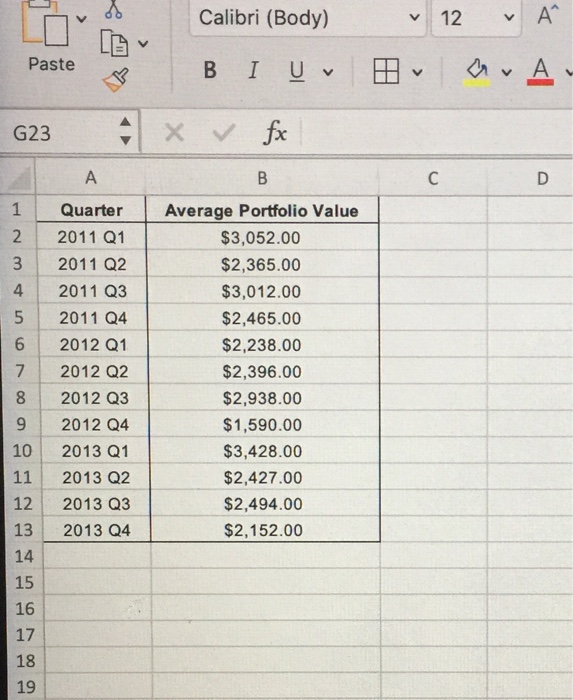
19. In a given table, the average stock returns for a portfolio are stored for various quarters. Create a chart for this data and answer the following questions. (Refer to worksheet"5.19") a. At what time was the portfolio value highest? b. At what time was the portfolio value lowest? c. What period of time (year and quarter) had the best average portfolio value? d. Does there seem to be a trend in this data? That is, can you guess what the next quarter's value will be? e. Do all chart types work well with this data? Can you identify a single chart type that is best suited for this data? Calibri (Body) Paste B Bra. A I U v fx G23 x D 1 Quarter 2011 Q1 2011 Q2 2011 Q3 2011 Q4 2012 Q1 2012 Q2 2012 Q3 2012 Q4 2013 Q1 2013 Q2 2013 Q3 2013 Q4 Average Portfolio Value $3,052.00 $2,365.00 $3,012.00 $2,465.00 $2,238.00 $2,396.00 $2,938.00 $1,590.00 $3,428.00 $2,427.00 $2,494.00 $2,152.00
Step by Step Solution
There are 3 Steps involved in it

Get step-by-step solutions from verified subject matter experts