

Question: 19 please answer all. I will give 10 downvotes for copied or incorrect answer. Problem 1. Woodard and Leone (2008) collected information about house and
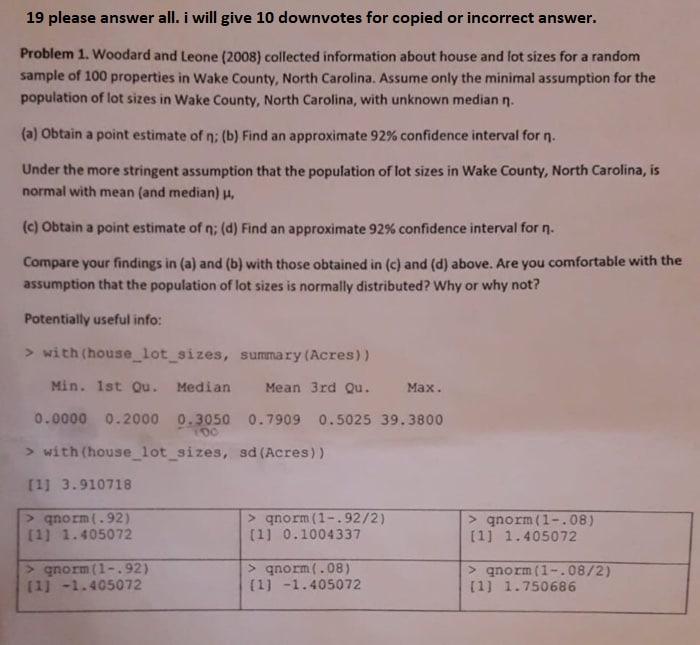
19 please answer all. I will give 10 downvotes for copied or incorrect answer. Problem 1. Woodard and Leone (2008) collected information about house and lot sizes for a random sample of 100 properties in Wake County, North Carolina. Assume only the minimal assumption for the population of lot sizes in Wake County, North Carolina, with unknown median n. (a) Obtain a point estimate of n; (b) Find an approximate 92% confidence interval forn. Under the more stringent assumption that the population of lot sizes in Wake County, North Carolina, is normal with mean (and median) H. (c) Obtain a point estimate of n; (d) Find an approximate 92% confidence interval for n. Compare your findings in (a) and (b) with those obtained in (c) and (d) above. Are you comfortable with the assumption that the population of lot sizes is normally distributed? Why or why not? Potentially useful info: > with (house_lot_sizes, summary (Acres)) Min. 1st Qu. Median Mean 3rd Qu. Max. 0.0000 0.2000 0.3050 0.7909 0.5025 39.3800 DO > with (house_lot_sizes, sd (Acres)) [1] 3.910718 qnorm(.92) [1] 1.405072 > qnorm (1-.92/2) [1] 0.1004337 > qnorm(1-.08) [1] 1.405072 > qnorm (1-.92) [1] -1.405072 > qnorm(.08) [1] -1.405072 > qnorm (1-.08/2) [1] 1.750686 19 please answer all. I will give 10 downvotes for copied or incorrect answer. Problem 1. Woodard and Leone (2008) collected information about house and lot sizes for a random sample of 100 properties in Wake County, North Carolina. Assume only the minimal assumption for the population of lot sizes in Wake County, North Carolina, with unknown median n. (a) Obtain a point estimate of n; (b) Find an approximate 92% confidence interval forn. Under the more stringent assumption that the population of lot sizes in Wake County, North Carolina, is normal with mean (and median) H. (c) Obtain a point estimate of n; (d) Find an approximate 92% confidence interval for n. Compare your findings in (a) and (b) with those obtained in (c) and (d) above. Are you comfortable with the assumption that the population of lot sizes is normally distributed? Why or why not? Potentially useful info: > with (house_lot_sizes, summary (Acres)) Min. 1st Qu. Median Mean 3rd Qu. Max. 0.0000 0.2000 0.3050 0.7909 0.5025 39.3800 DO > with (house_lot_sizes, sd (Acres)) [1] 3.910718 qnorm(.92) [1] 1.405072 > qnorm (1-.92/2) [1] 0.1004337 > qnorm(1-.08) [1] 1.405072 > qnorm (1-.92) [1] -1.405072 > qnorm(.08) [1] -1.405072 > qnorm (1-.08/2) [1] 1.750686
Step by Step Solution
There are 3 Steps involved in it

Get step-by-step solutions from verified subject matter experts