

Question: 19.1 You are given the following data: > t = [0 .1 .499 .5 .6 1.0 > y = [0 .06.17 .19 .21 .26 1.4
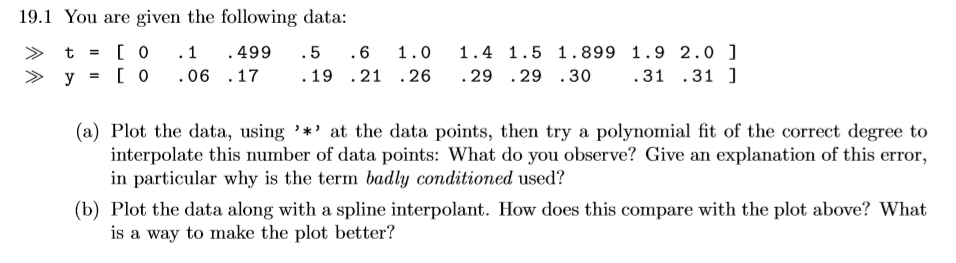
19.1 You are given the following data: > t = [0 .1 .499 .5 .6 1.0 > y = [0 .06.17 .19 .21 .26 1.4 1.5 1.899 1.9 2.0 ] .29.29.30 .31.31 ] (a) Plot the data, using '*' at the data points, then try a polynomial fit of the correct degree to interpolate this number of data points: What do you observe? Give an explanation of this error, in particular why is the term badly conditioned used? (b) Plot the data along with a spline interpolant. How does this compare with the plot above? What is a way to make the plot better? 19.1 You are given the following data: > t = [0 .1 .499 .5 .6 1.0 > y = [0 .06.17 .19 .21 .26 1.4 1.5 1.899 1.9 2.0 ] .29.29.30 .31.31 ] (a) Plot the data, using '*' at the data points, then try a polynomial fit of the correct degree to interpolate this number of data points: What do you observe? Give an explanation of this error, in particular why is the term badly conditioned used? (b) Plot the data along with a spline interpolant. How does this compare with the plot above? What is a way to make the plot better
Step by Step Solution
There are 3 Steps involved in it

Get step-by-step solutions from verified subject matter experts