

Question: 192 CHAPTER 12 . LINEAR REGRESSION AND CORRELATE Table 125 a . Decide which variable should be the independent variable and which should be the
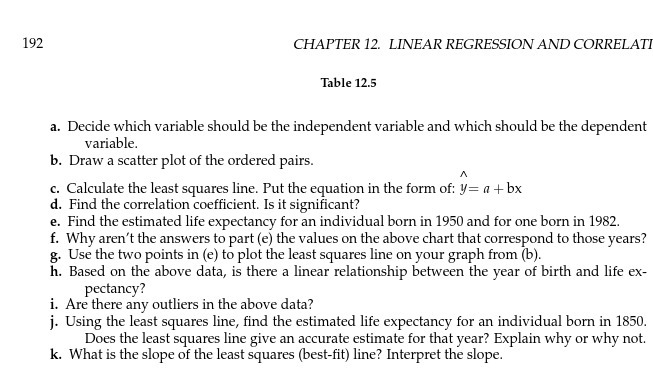
192 CHAPTER 12 . LINEAR REGRESSION AND CORRELATE Table 125 a . Decide which variable should be the independent variable and which should be the dependent variable b . Draw a scatter plot of the ordered pairs C . Calculate the least squares line . Put the equation in the form of y = 1 + box I . Find the correlation coefficient Is it significan e . Find the estimated life expectancy for an individual born in 1950 and for one born in 1982 I . Why aren't the answers to part ( e ) the values on the above chart that correspond to those years ? B . Use the two points in (e ) to plot the least squares line on your graph from ( b ) . Based on the above data , is there a linear relationship between the year of birth and life ex peclancy Are there any outliers in the above data ? 1 . Using the least squares line , find the estimated life expectancy for an individual born in 1850 Does the least squares line give an accurate estimate for that year ? Explain why or why not . K . What is the slope of the least squares ( best - fit line ? Interpret the slope
Step by Step Solution
There are 3 Steps involved in it

Get step-by-step solutions from verified subject matter experts