

Question: 1950 data and one for the 2075 data. Note: the Y-axis should be the vertical scale in percent for both the 1950 and 2075 population
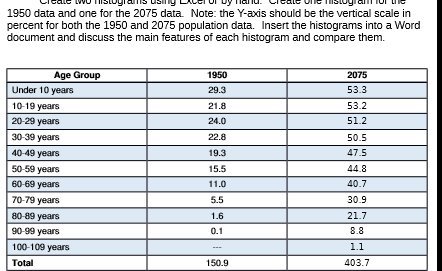
1950 data and one for the 2075 data. Note: the Y-axis should be the vertical scale in percent for both the 1950 and 2075 population data. Insert the histograms into a Word document and discuss the main features of each histogram and compare them. Age Group 1950 2075 Under 10 years 29.3 53.3 10-19 years 21.8 53.2 20-29 years 24.0 51 2 30-39 years 22.8 50.5 40-49 years 19.3 47 5 50-59 years 15.5 44 8 60-69 years 11.0 40.7 70-79 years 5.5 30.9 80-89 years 1.6 21.7 90-99 years 0. 1 8.8 100-109 years 1.1 Total 150.9 403.7
Step by Step Solution
There are 3 Steps involved in it
1 Expert Approved Answer
Step: 1 Unlock

Question Has Been Solved by an Expert!
Get step-by-step solutions from verified subject matter experts
Step: 2 Unlock
Step: 3 Unlock