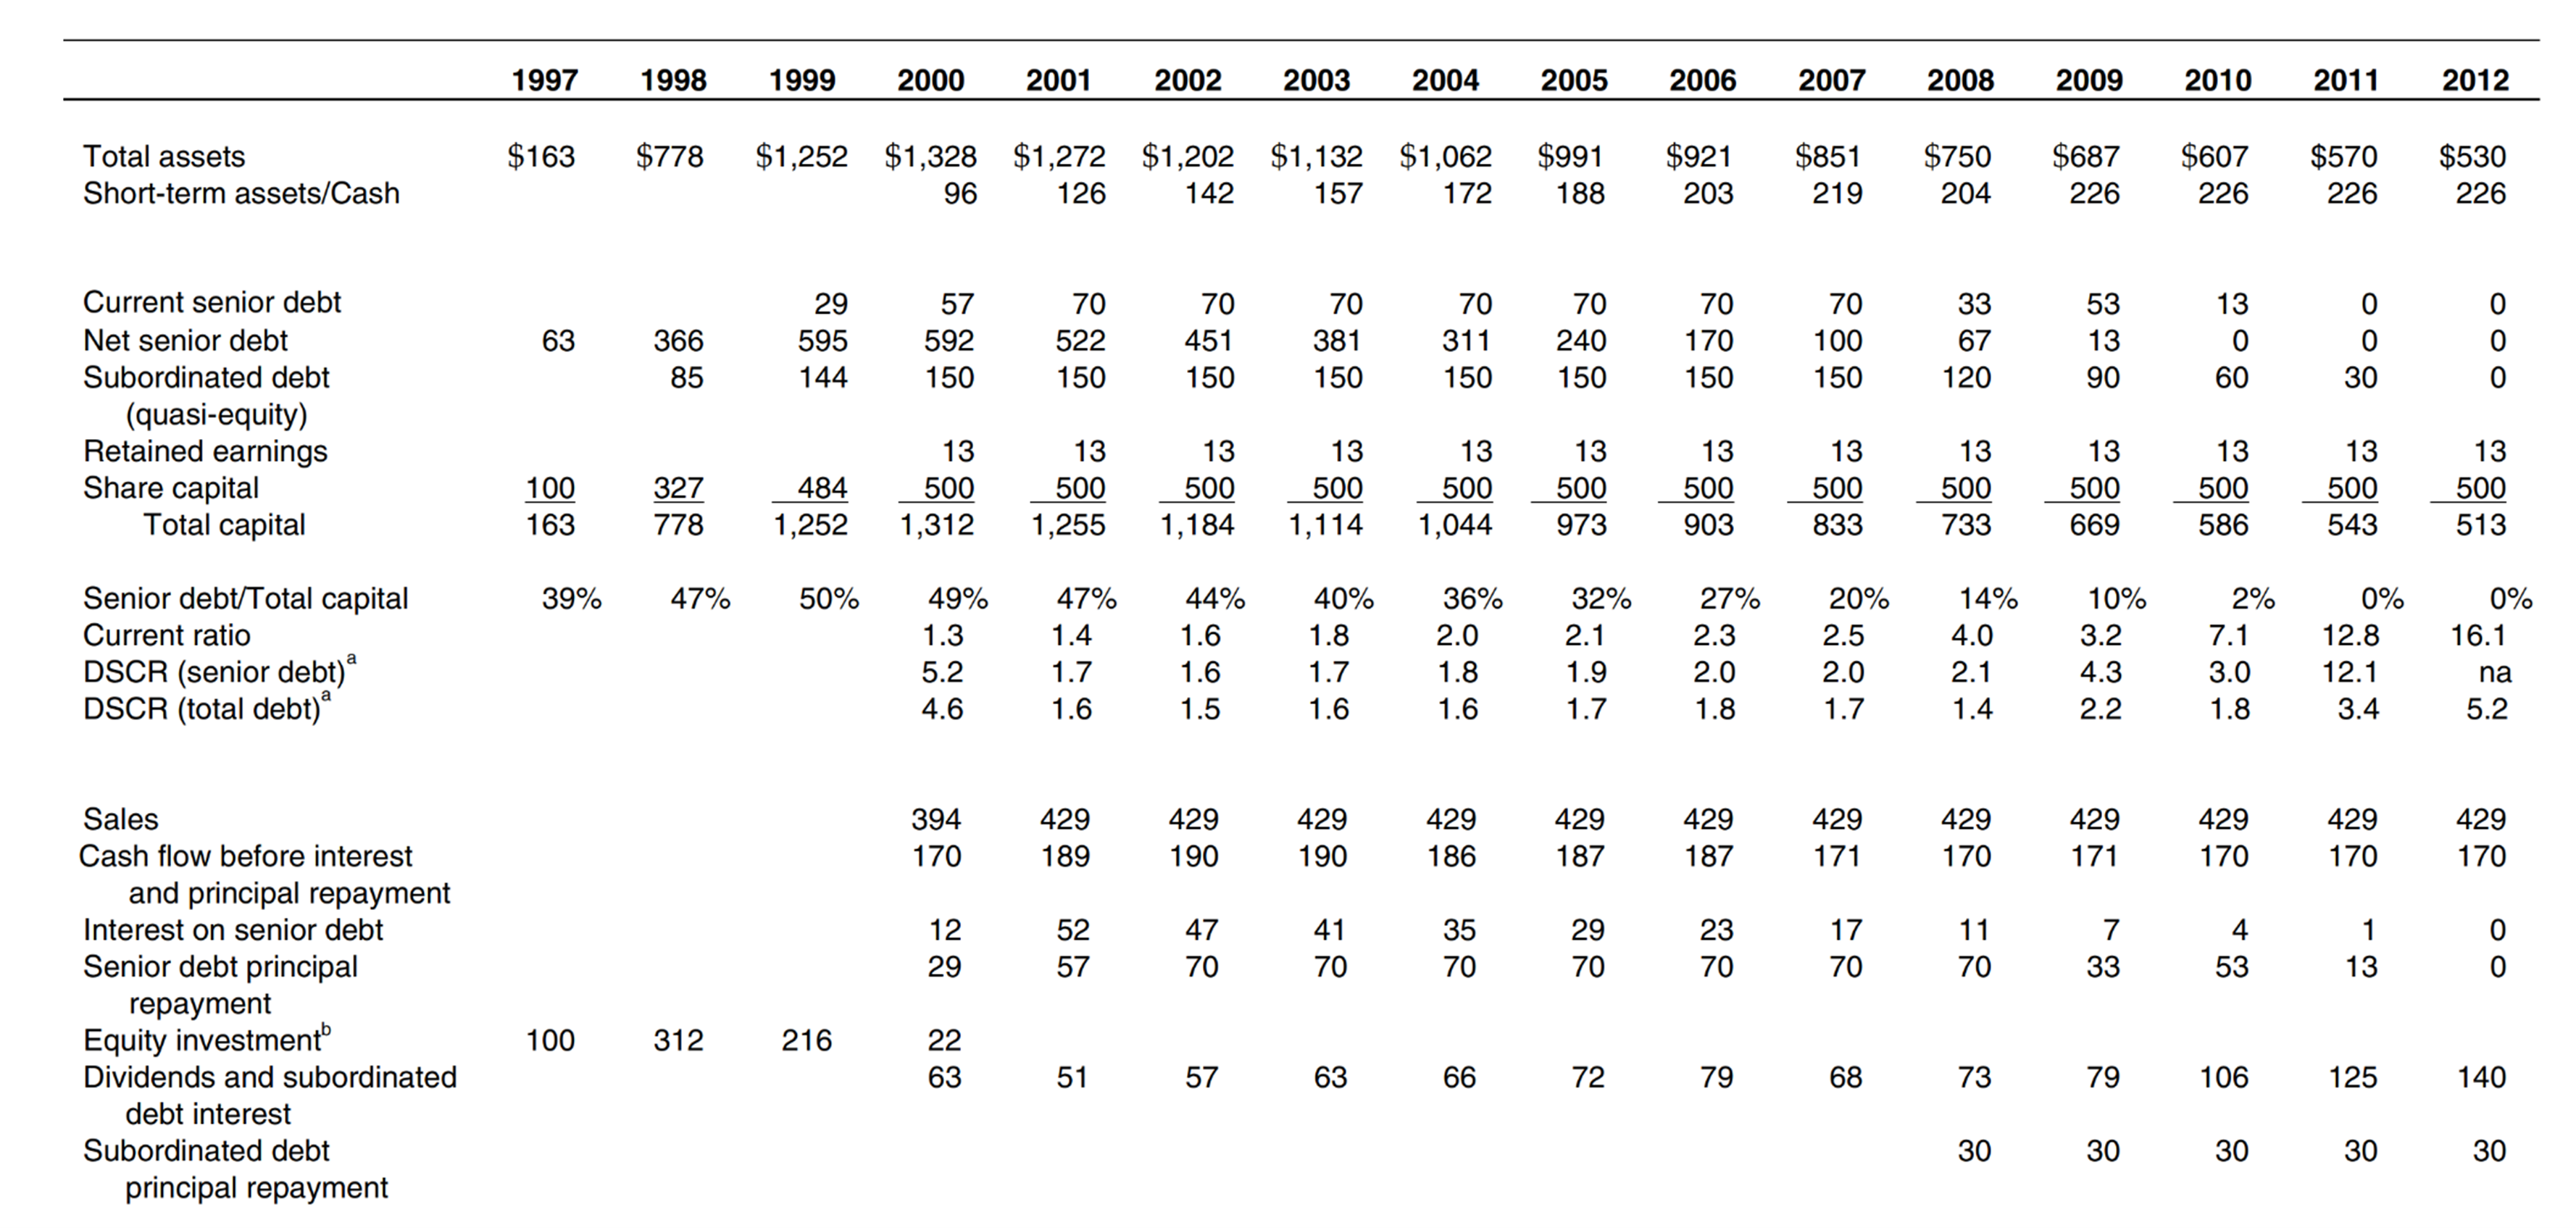
Question: 1997 1998 1999 2000 2001 2002 2003 2004 2005 2006 2007 2008 2009 2010 2011 2012 Total assets $163 $778 $1 ,252 $1 ,328 $1

1997 1998 1999 2000 2001 2002 2003 2004 2005 2006
1997 1998 1999 2000 2001 2002 2003 2004 2005 2006 2007 2008 2009 2010 2011 2012 Total assets $163 $778 $1 ,252 $1 ,328 $1 ,272 $1 ,202 $1,132 $1 ,062 $991 $921 $851 $750 $687 $607 $570 $530 Short-term assets/Cash 96 126 142 157 172 188 203 219 204 226 226 226 226 Current senior debt 29 57 70 70 70 70 70 70 70 33 53 13 O 0 Net senior debt 63 366 595 592 522 451 381 31 1 240 170 100 67 13 0 0 0 Subordinated debt 85 144 150 150 150 150 150 150 150 150 120 90 60 30 0 (quasi-equity) Retained earnings 13 13 13 13 13 13 13 13 13 13 13 13 13 Share capital 100 327 484 500 500 500 500 500 500 500 500 500 500 500 500 500 Total capital 163 778 1,252 1,312 1,255 1,184 1,1 14 1,044 973 903 833 733 669 586 543 513 Senior debt/Total capital 39% 47% 50% 49% 47% 44% 40% 36% 32% 27% 20% 14% 10% 2% 0% 0% Current ratio 1.3 1.4 1.6 1.8 2.0 2.1 2.3 2.5 4.0 3.2 7.1 12.8 16.1 DSCR (senior debt)9 5.2 1.7 1.6 1.7 1.8 1.9 2.0 2.0 2.1 4.3 3.0 121 na DSCR (total debt)9 4.6 1.6 1.5 1.6 1.6 1.7 1.8 1.7 1.4 2.2 1.8 3.4 5.2 Sales 394 429 429 429 429 429 429 429 429 429 429 429 429 Cash flow before interest 170 189 190 190 186 187 187 171 170 171 170 170 170 and principal repayment Interest on senior debt 12 52 47 41 35 29 23 17 11 7 4 1 0 Senior debt principal 29 57 70 70 70 70 70 70 70 33 53 13 0 repayment Equity investmentb 100 312 216 22 Dividends and subordinated 63 51 57 63 66 72 79 68 73 79 106 125 140 debt interest Subordinated debt 30 30 30 30 30 principal repayment

Step by Step Solution

There are 3 Steps involved in it

1 Expert Approved Answer
Step: 1 Unlock blur-text-image
Question Has Been Solved by an Expert!

Get step-by-step solutions from verified subject matter experts

Step: 2 Unlock
Step: 3 Unlock

Students Have Also Explored These Related Finance Questions!