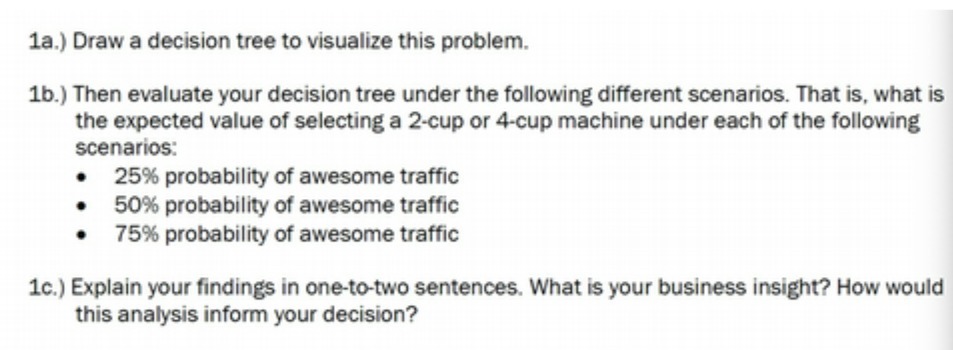
Question: 1a.) Draw a decision tree to visualize this problem. 1b.) Then evaluate your decision tree under the following different scenarios. That is, what is the

1a.) Draw a decision tree to visualize this
1a.) Draw a decision tree to visualize this problem. 1b.) Then evaluate your decision tree under the following different scenarios. That is, what is the expected value of selecting a 2-cup or 4-cup machine under each of the following scenarios: 25% probability of awesome traffic 50% probability of awesome traffic 75% probability of awesome traffic 1c.) Explain your findings in one-to-two sentences. What is your business insight? How would this analysis inform your decision

Step by Step Solution

There are 3 Steps involved in it

1 Expert Approved Answer
Step: 1 Unlock blur-text-image
Question Has Been Solved by an Expert!

Get step-by-step solutions from verified subject matter experts

Step: 2 Unlock
Step: 3 Unlock

Students Have Also Explored These Related Accounting Questions!