

Question: 1a) The consumption function captures one of the key relationships in economics. It expresses consumption as a function of disposal income, where disposable income is
1a)
The consumption function captures one of the key relationships in economics. It expresses consumption as a function of disposal income, where disposable income is income after taxes. The attached file RegressionDataset1 shows data of average US annual consumption (in $) and disposable income (in $) for the years 2000 to 2016.
a) What is the Pearson correlation value between income and consumption? (Use two decimals)
---------------------------------------------------------------------------------------------------------------------------------------------------------------------------------------------------------------------------------------------------------
1b)
The consumption function captures one of the key relationships in economics. It expresses consumption as a function of disposal income, where disposable income is income after taxes. The attached file RegressionDataset1 shows data of average US annual consumption (in $) and disposable income (in $) for the years 2000 to 2016.
b) Find the sample linear regression equation for the model. What is the intercept of the model? (Use two decimals)
---------------------------------------------------------------------------------------------------------------------------------------------------------------------------------------------------------------------------------------------------------
1c)
The consumption function captures one of the key relationships in economics. It expresses consumption as a function of disposal income, where disposable income is income after taxes. The attached file RegressionDataset1 shows data of average US annual consumption (in $) and disposable income (in $) for the years 2000 to 2016.
c) Find the sample linear regression equation for the model. What is the coefficient of the Income Variable? (Use two decimals)
---------------------------------------------------------------------------------------------------------------------------------------------------------------------------------------------------------------------------------------------------------
1d)
The consumption function captures one of the key relationships in economics. It expresses consumption as a function of disposal income, where disposable income is income after taxes. The attached file RegressionDataset1 shows data of average US annual consumption (in $) and disposable income (in $) for the years 2000 to 2016.
d) What is the predicted consumption if the disposable income is $100? (Use Two decimals)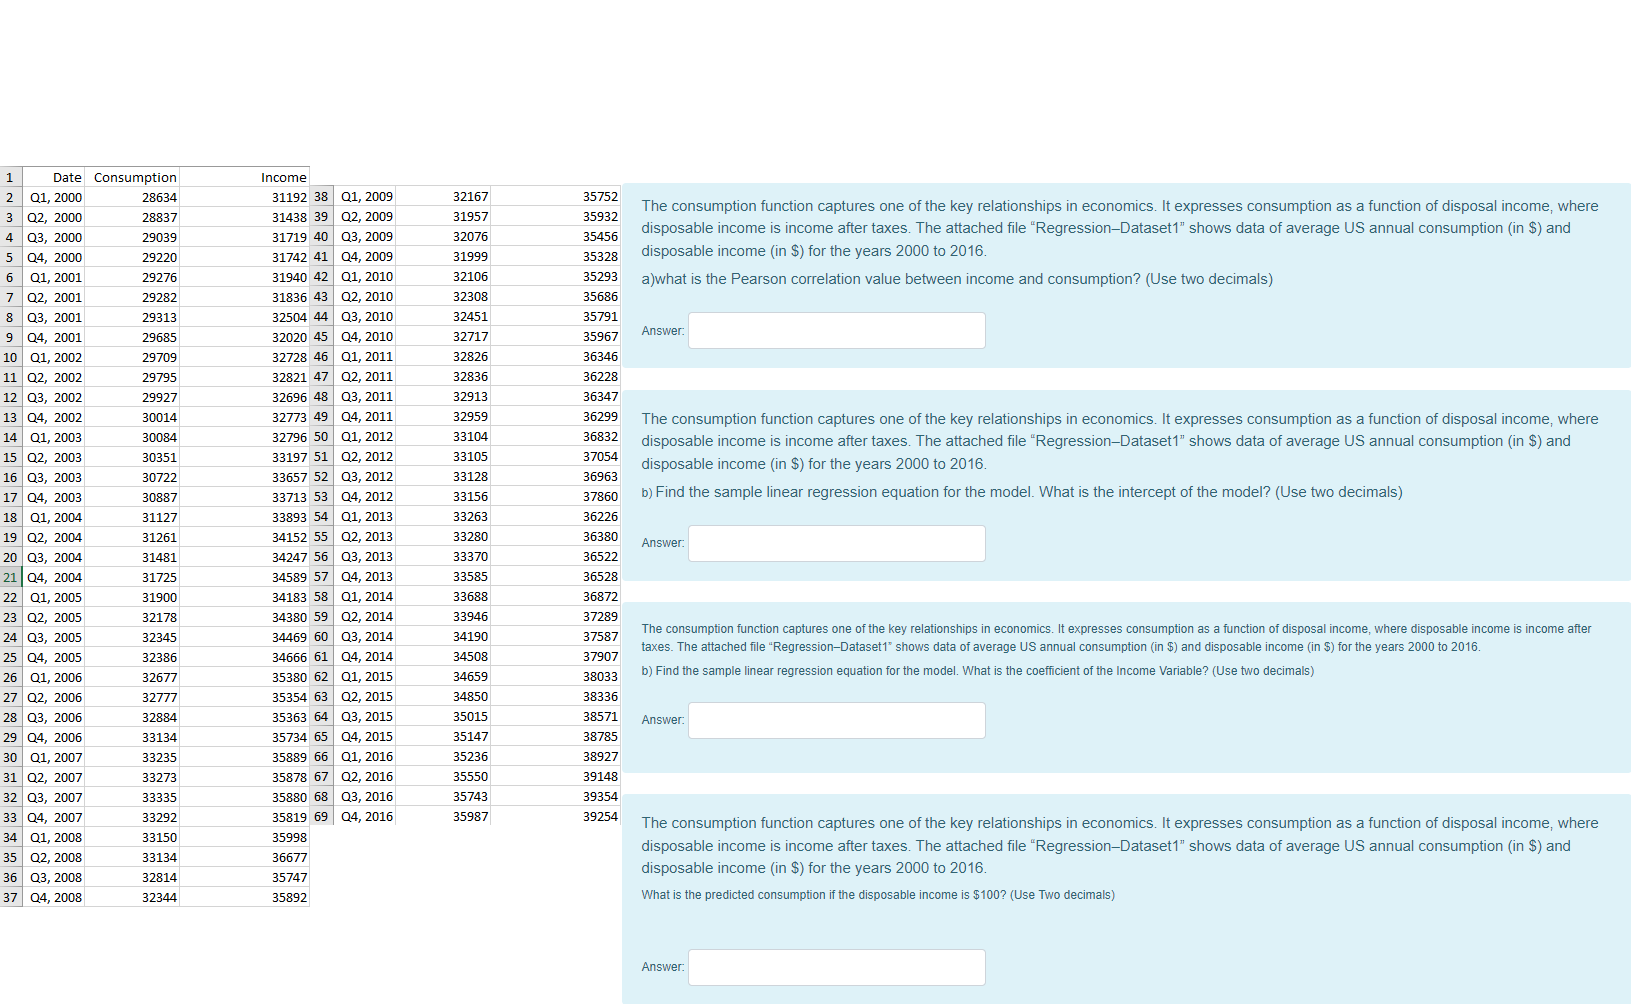
The consumption function captures one of the key relationships in economics. It expresses consumption as a function of disposal income, where disposable income is income after taxes. The attached file "Regression-Dataset1" shows data of average US annual consumption (in $) and disposable income (in $) for the years 2000 to 2016. a)what is the Pearson correlation value between income and consumption? (Use two decimals) Answer: 1 Date Consumption 2 Q1, 2000 28634 3 Q2, 2000 28837 4 Q3, 2000 29039 5 Q4, 2000 29220 6 Q1, 2001 29276 7 Q2, 2001 29282 8 Q3, 2001 29313 9 Q4, 2001 29685 10 01, 2002 29709 11 Q2, 2002 29795 12 Q3, 2002 29927 13 Q4, 2002 30014 14 01, 2003 30084 15 Q2, 2003 30351 16 Q3, 2003 30722 17 Q4, 2003 30887 18 01, 2004 31127 19 Q2, 2004 31261 20 Q3, 2004 31481 2104, 2004 31725 22 Q1, 2005 31900 23 Q2, 2005 32178 24 Q3, 2005 32345 25 Q4, 2005 32386 26 01, 2006 32677 27 Q2, 2006 32777 28 Q3, 2006 32884 29 Q4, 2006 33134 30 Q1, 2007 33235 31 Q2, 2007 33273 32 Q3, 2007 33335 33 04, 2007 33292 34 Q1, 2008 33150 35 Q2, 2008 33134 36 Q3, 2008 32814 37 Q4, 2008 32344 Income 31192 38 Q1, 2009 31438 39 02, 2009 31719 40 Q3, 2009 31742 41 Q4, 2009 31940 42 Q1, 2010 31836 43 Q2, 2010 32504 44 Q3, 2010 32020 45 Q4, 2010 32728 46 Q1, 2011 32821 47 Q2, 2011 32696 48 Q3, 2011 32773 49 Q4, 2011 32796 50 Q1, 2012 33197 51 Q2, 2012 33657 52 Q3, 2012 33713 53 04, 2012 33893 54 Q1, 2013 34152 55 Q2, 2013 34247 56 Q3, 2013 34589 57 Q4, 2013 34183 58 01, 2014 34380 59 Q2, 2014 34469 60 Q3, 2014 34666 61 Q4, 2014 35380 62 01, 2015 35354 63 Q2, 2015 35363 64 Q3, 2015 35734 65 Q4, 2015 35889 66 Q1, 2016 35878 67 Q2, 2016 35880 68 Q3, 2016 35819 69 04, 2016 35998 36677 35747 35892 32167 31957 32076 31999 32106 32308 32451 32717 32826 32836 32913 32959 33104 33105 33128 33156 33263 33280 33370 33585 33688 33946 34190 34508 34659 34850 The consumption function captures one of the key relationships in economics. It expresses consumption as a function of disposal income, where disposable income is income after taxes. The attached file "Regression-Dataset1" shows data of average US annual consumption (in $) and disposable income (in $) for the years 2000 to 2016. b) Find the sample linear regression equation for the model. What is the intercept of the model? (Use two decimals) 35752 35932 35456 35328 35293 35686 35791 35967 36346 36228 36347 36299 36832 37054 36963 37860 36226 36380 36522 36528 36872 37289 Answer: 37587 37907 38033 38336 The consumption function captures one of the key relationships in economics. It expresses consumption as a function of disposal income, where disposable income is income after taxes. The attached file "Regression-Dataset1' shows data of average US annual consumption (in $) and disposable income (in $) for the years 2000 to 2016. b) Find the sample linear regression equation for the model. What is the coefficient of the Income Variable? (Use two decimals) 35015 Answer: 35147 35236 35550 35743 35987 38571 38785 38927 39148 39354 39254 The consumption function captures one of the key relationships in economics. It expresses consumption as a function of disposal income, where disposable income is income after taxes. The attached file "Regression-Dataset1" shows data of average US annual consumption (in $) and disposable income (in $) for the years 2000 to 2016. What is the predicted consumption if the disposable income is $100? (Use Two decimals)
Step by Step Solution
There are 3 Steps involved in it

Get step-by-step solutions from verified subject matter experts