

Question: 1A variable X follows a uniform distribution, as shown below: IOR 2 6 8 X IQR. = 4 The distribution of X has an interquartile
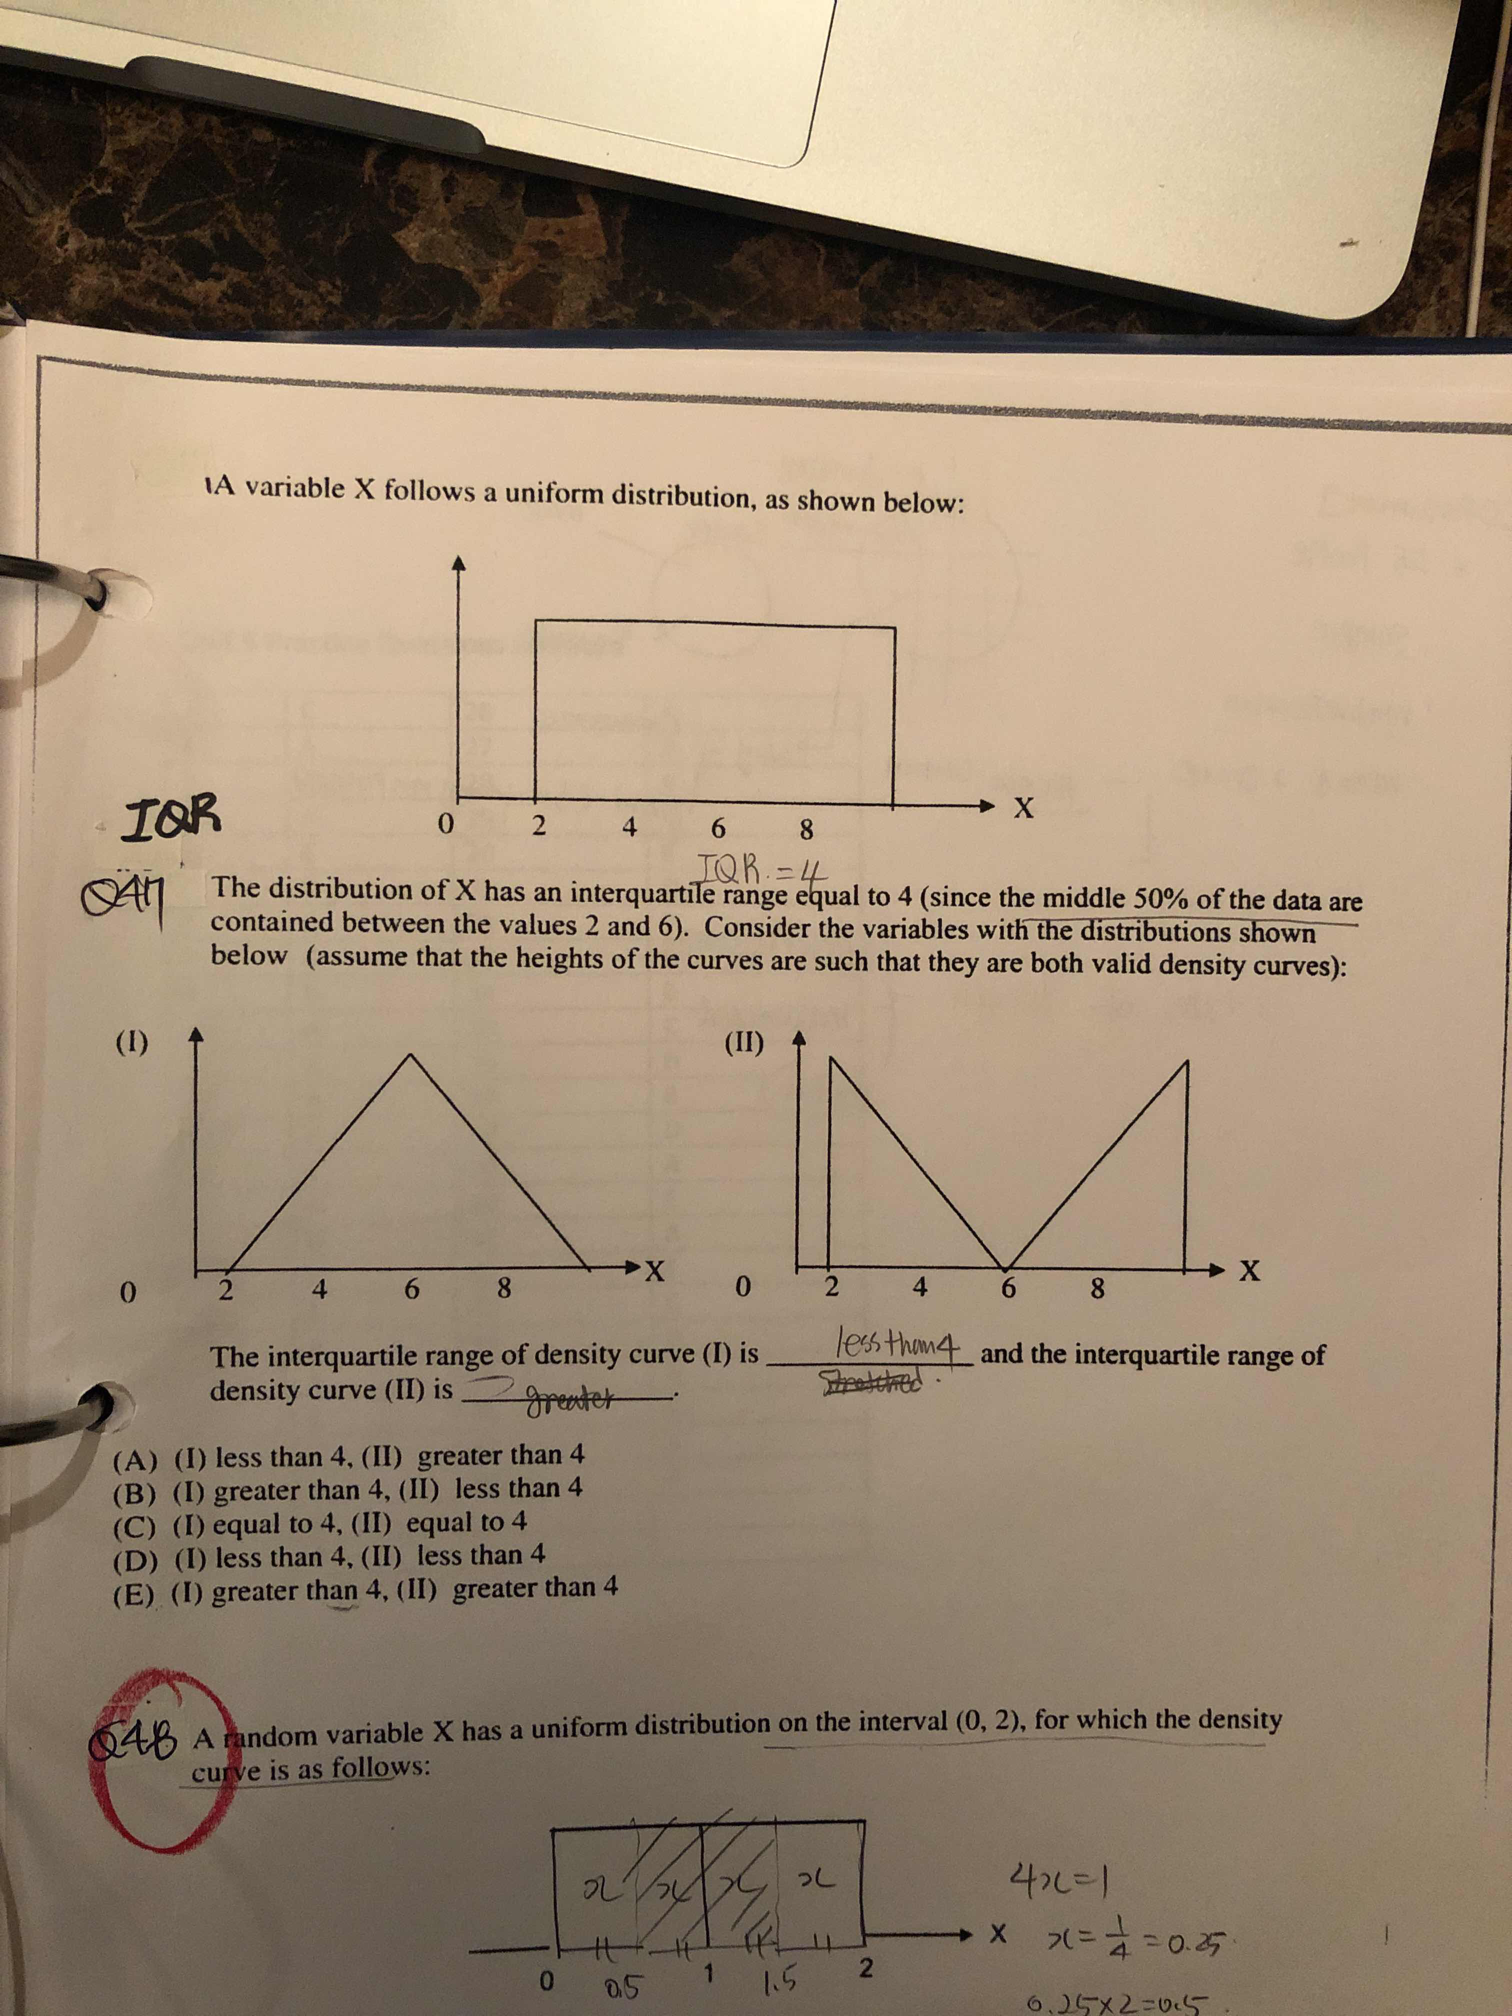
1A variable X follows a uniform distribution, as shown below: IOR 2 6 8 X IQR. = 4 The distribution of X has an interquartile range equal to 4 (since the middle 50% of the data are contained between the values 2 and 6). Consider the variables with the distributions shown below (assume that the heights of the curves are such that they are both valid density curves): (1) (II) 0 6 8 X 0 2 8 X The interquartile range of density curve (I) is density curve (II) is less than and the interquartile range of greater (A) (I) less than 4, (II) greater than 4 (B) (I) greater than 4, (II) less than 4 (C) (I) equal to 4, (II) equal to 4 (D) (I) less than 4, (II) less than 4 (E) (I) greater than 4, (II) greater than 4 2to A random variable X has a uniform distribution on the interval (0, 2), for which the density curve is as follows: 476 = 1 X 71= = 0.25 10 05 1 1.5 2 .25X2=05
Step by Step Solution
There are 3 Steps involved in it

Get step-by-step solutions from verified subject matter experts