

Question: 1A. What does your T test result indicate about the differences between the male arrestee population and the female arrestee population in NYC in 1989?
1A. What does your T test result indicate about the differences between the male arrestee population and the female arrestee population in NYC in 1989?
1B. State the Null Hypothesis for this test, and your conclusion about the result of the test in a sentence or two.
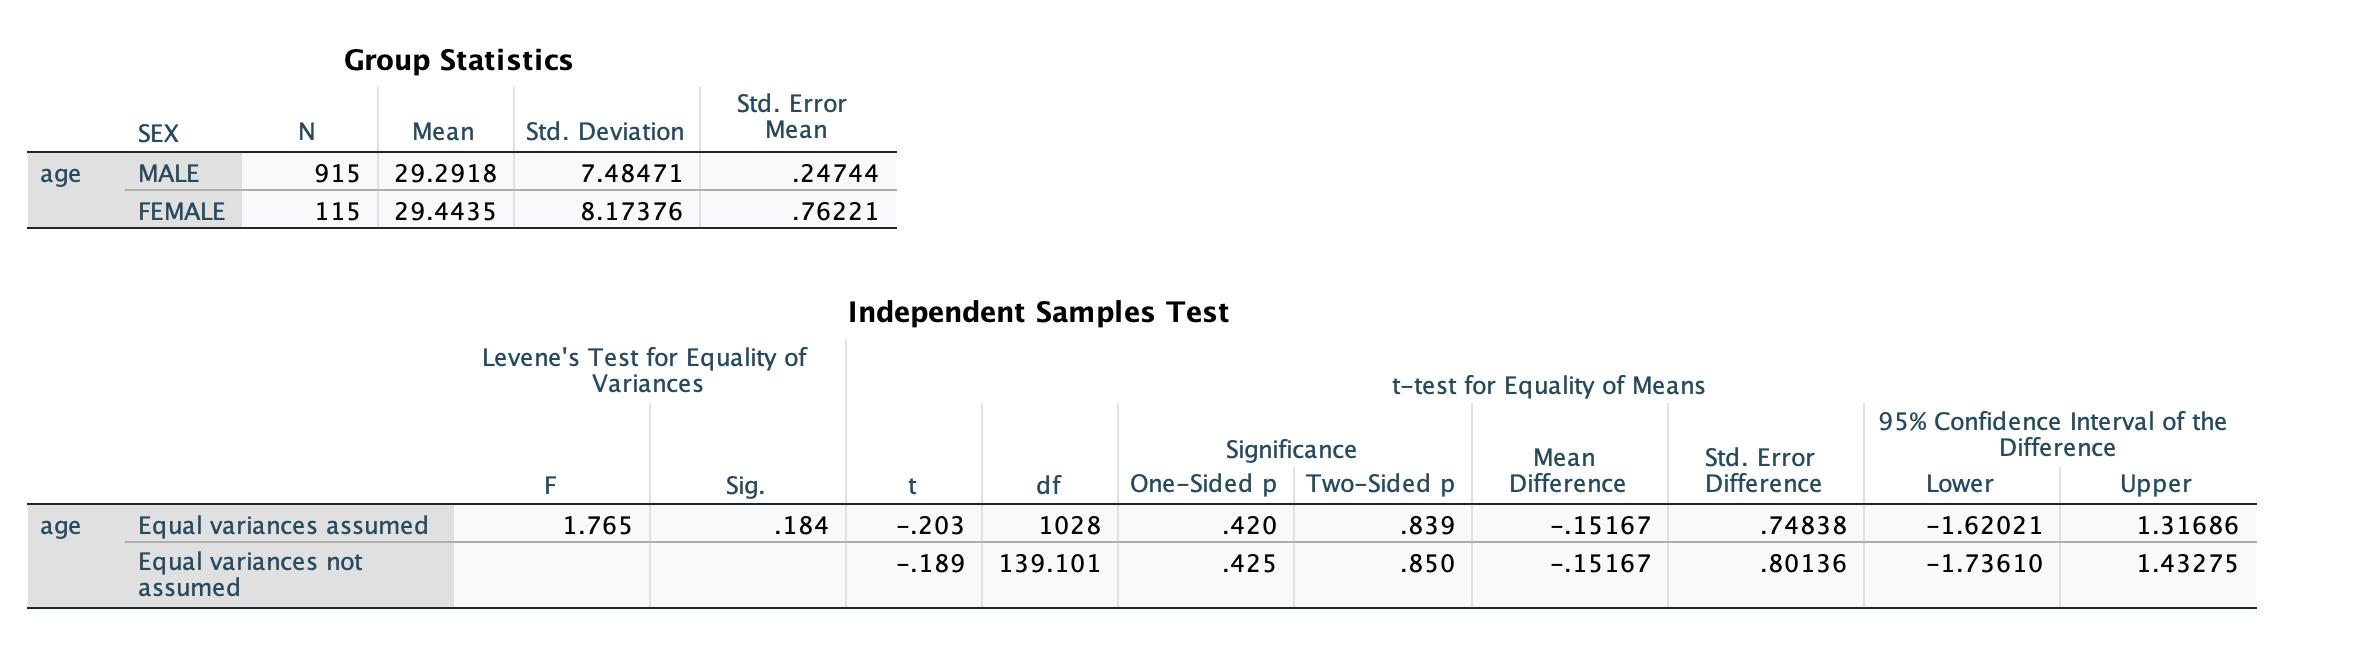
age age SEX MALE FEMALE Group Statistics Mean Std. Deviation 7.48471 8.17376 N 915 29.2918 115 29.4435 Equal variances assumed Equal variances not assumed F Std. Error Mean Levene's Test for Equality of Variances 1.765 .24744 .76221 Sig. .184 Independent Samples Test t -.203 -.189 df 1028 139.101 t-test for Equality of Means Significance One-Sided p Two-Sided p .420 .425 .839 .850 Mean Difference -.15167 -.15167 Std. Error Difference .74838 .80136 95% Confidence Interval of the Difference Lower -1.62021 -1.73610 Upper 1.31686 1.43275
Step by Step Solution
3.44 Rating (157 Votes )
There are 3 Steps involved in it
The ttest results in the image you sent indicate that there is no statistically significant differen... View full answer

Get step-by-step solutions from verified subject matter experts