

Question: 1.College Students - Age (a) Construct a histogram based on the given frequency distribution of college student ages.Use the class midpoints to scale your horizontal
1.College Students - Age
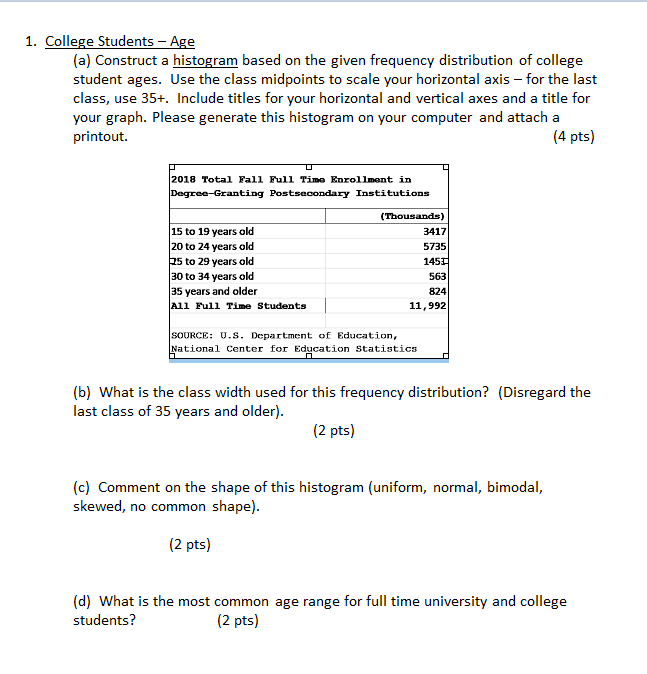
(a) Construct a histogram based on the given frequency distribution of college student ages.Use the class midpoints to scale your horizontal axis - for the last class, use 35+.Include titles for your horizontal and vertical axes and a title for your graph. Please generate this histogram on your computer and attach a printout. (4 pts)
(b)What is the class width used for this frequency distribution?(Disregard the last class of 35 years and older). (2 pts)
(c)Comment on the shape of this histogram (uniform, normal, bimodal, skewed, no common shape).
(2 pts)
(d)What is the most common age range for full time university and college students? (2 pts)
2.Demographics
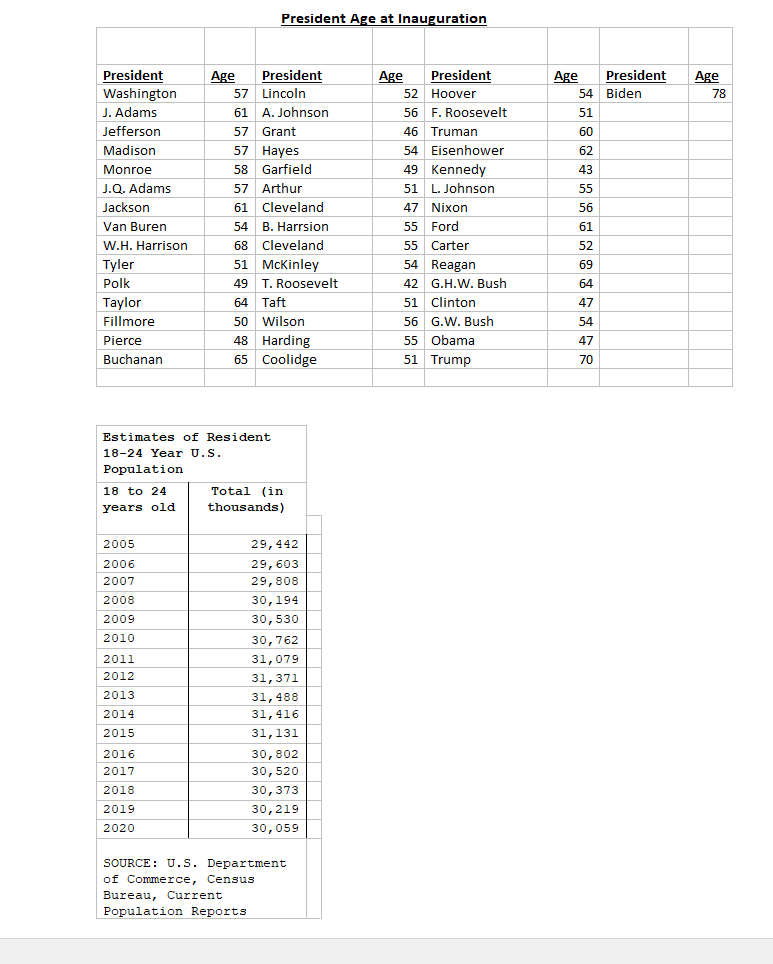
(a)Construct a time series graph of the number of 18 - 24 year olds in the US population. Include titles for your horizontal and vertical axes and a title for the graph. Please generate this graph on your computer and attach a printout. (4 pts)
(b)Given the histogram in question #1, is this a problem for US colleges? Give a brief explanation.
(2 pts)
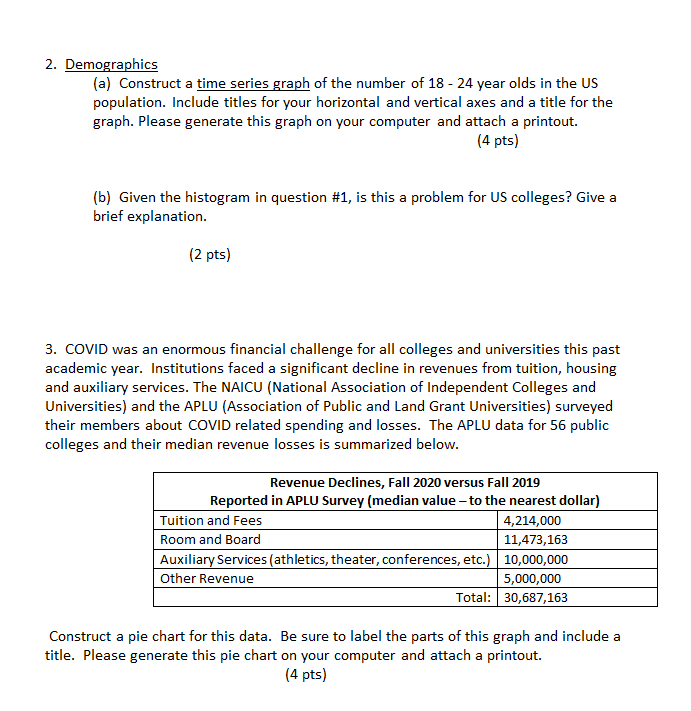
3.COVID was an enormous financial challenge for all colleges and universities this past academic year.Institutions faced a significant decline in revenues from tuition, housing and auxiliary services. The NAICU (National Association of Independent Colleges and Universities) and the APLU (Association of Public and Land Grant Universities) surveyed their members about COVID related spending and losses.The APLU data for 56 public colleges and their median revenue losses is summarized below.
Revenue Declines, Fall 2020 versus Fall 2019
Reported in APLU Survey (median value - to the nearest dollar)
Tuition and Fees 4,214,000
Room and Board 11,473,163
Auxiliary Services (athletics, theater, conferences, etc.) 10,000,000
Other Revenue 5,000,000
Total: 30,687,163
Construct a pie chart for this data.Be sure to label the parts of this graph and include a title.Please generate this pie chart on your computer and attach a printout. (4 pts)
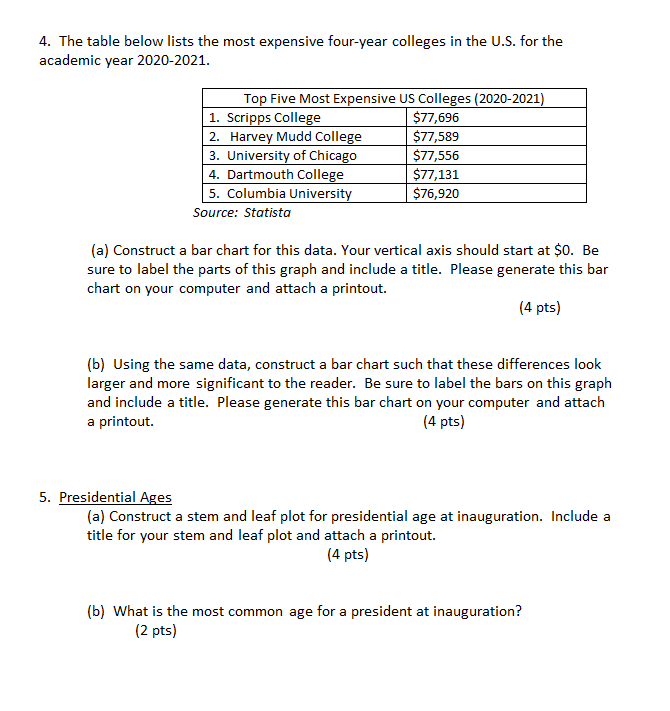
4.The table below lists the most expensive four-year colleges in the U.S. for the academic year 2020-2021.
Top Five Most Expensive US Colleges (2020-2021)
1.Scripps College $77,696
2.Harvey Mudd College $77,589
3.University of Chicago $77,556
4.Dartmouth College $77,131
5.Columbia University $76,920
Source:Statista
(a) Construct a bar chart for this data. Your vertical axis should start at $0.Be sure to label the parts of this graph and include a title.Please generate this bar chart on your computer and attach a printout. (4 pts)
(b)Using the same data, construct a bar chart such that these differences look larger and more significant to the reader.Be sure to label the bars on this graph and include a title.Please generate this bar chart on your computer and attach a printout. (4 pts)
5.Presidential Ages
(a) Construct a stem and leaf plot for presidential age at inauguration.Include a title for your stem and leaf plot and attach a printout. (4 pts)
(b)What is the most common age for a president at inauguration? (2 pts)
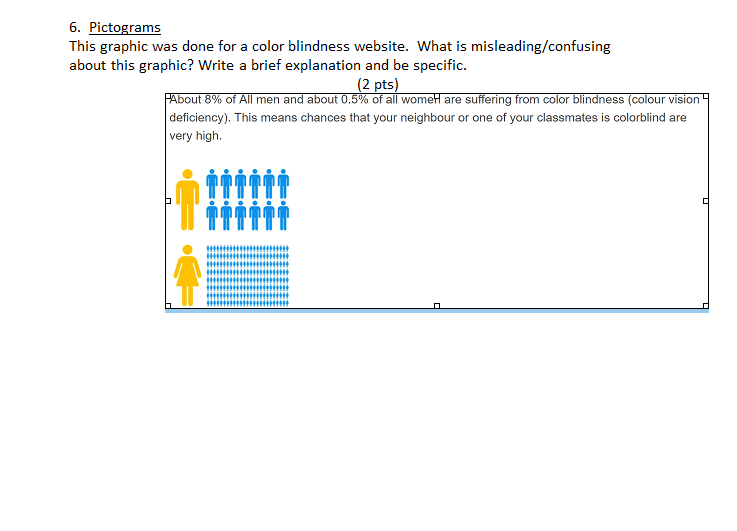
6.Pictograms
This graphic was done for a color blindness website.What is misleading/confusing about this graphic? Write a brief explanation and be specific. (2 pts)
President Age at Inauguration
President Age President Age President Age President Age
Washington 57 Lincoln 52 Hoover 54 Biden 78
J. Adams 61 A. Johnson 56 F. Roosevelt 51
Jefferson 57 Grant 46 Truman 60
Madison 57 Hayes 54 Eisenhower 62
Monroe 58 Garfield 49 Kennedy 43
J.Q. Adams 57 Arthur 51 L. Johnson 55
Jackson 61 Cleveland 47 Nixon 56
Van Buren 54 B. Harrsion 55 Ford 61
W.H. Harrison 68 Cleveland 55 Carter 52
Tyler 51 McKinley 54 Reagan 69
Polk 49 T. Roosevelt 42 G.H.W. Bush 64
Taylor 64 Taft 51 Clinton 47
Fillmore 50 Wilson 56 G.W. Bush 54
Pierce 48 Harding 55 Obama 47
Buchanan 65 Coolidge 51 Trump 70
Estimates of Resident 18-24 Year U.S. Population
18 to 24 years old Total (in thousands)
2005 29,442
2006 29,603
2007 29,808
2008 30,194
2009 30,530
2010 30,762
2011 31,079
2012 31,371
2013 31,488
2014 31,416
2015 31,131
2016 30,802
2017 30,520
2018 30,373
2019 30,219
2020 30,059
SOURCE: U.S. Department of Commerce, Census Bureau, Current Population Reports
1. College Students - Age (a) Construct a histogram based on the given frequency distribution of college student ages. Use the class midpoints to scale your horizontal axis - for the last class, use 35+. Include titles for your horizontal and vertical axes and a title for your graph. Please generate this histogram on your computer and attach a printout. (4 pts) 2018 Total Fall Full Time Enrollment in Degree-Granting Postsecondary Institutions (Thousands] 15 to 19 years old 3417 20 to 24 years old 5735 35 to 29 years old 1453 30 to 34 years old 563 35 years and older 824 All Full Time Students 11,992 SOURCE: U.S. Department of Education, National Center for Education Statistics (b) What is the class width used for this frequency distribution? (Disregard the last class of 35 years and older). (2 pts) (c) Comment on the shape of this histogram (uniform, normal, bimodal, skewed, no common shape). (2 pts) (d) What is the most common age range for full time university and college students? (2 pts)2. Demographics [a] Construct a time series graph of the number of 13 24 year olds in the US population. Include titles for your horizontal and vertical axes and a title for the graph. Please generate this graph on your computer and attach a printout. [4 pts] [b] Given the histogram in question #1, is this a problem for US colleges? Give a brief explanation. [2 pts] 3. CO'v'lD 1uvas an enormous financial challenge for all colleges and universities this past academic year. Institutions faced a significant decline in revenues from tuition, housing and auxiliary services. The NAICU [National Association of Independent Colleges and Universities] and the APLU [Association of Public and Land Grant Universities] surveyed their members about CD'v'ID related spending and losses. The APLU data for 55 public colleges and their median revenue losses is summarized below. Revenue Declines, Fall 2020 versus Fall 2019 Reported in APLU Survey [median value to the nearest dollar] Tuition and Fees 4,214 000 AuxiliaryServices (athletics, theater, conferences, etc.] Construct a pie chart for this data. Be sure to label the parts of this graph and include a title. Please generate this pie chart on your computer and attach a printout. [4 pts] 4. The table below lists the most expensive four-year colleges in the U.S. for the academic year 2020-2021. Top Five Most Expensive US Colleges (2020-2021) 1. Scripps College $77,696 2. Harvey Mudd College $77,589 3. University of Chicago $77,556 4. Dartmouth College $77,131 5. Columbia University $76,920 Source: Statista (a) Construct a bar chart for this data. Your vertical axis should start at $0. Be sure to label the parts of this graph and include a title. Please generate this bar chart on your computer and attach a printout. (4 pts) (b) Using the same data, construct a bar chart such that these differences look larger and more significant to the reader. Be sure to label the bars on this graph and include a title. Please generate this bar chart on your computer and attach a printout. (4 pts) 5. Presidential Ages (a) Construct a stem and leaf plot for presidential age at inauguration. Include a title for your stem and leaf plot and attach a printout. (4 pts) (b) What is the most common age for a president at inauguration? (2 pts)6. Pictograms This graphic was done for a color blindness website. What is misleading/confusing about this graphic? Write a brief explanation and be specific. (2 pts) About 8% of All men and about 0.5% of all women are suffering from color blindness (colour vision 4 deficiency). This means chances that your neighbour or one of your classmates is colorblind are very high. TTTTTTPresident Age at Inauguration President Age President Age President Age President Age 57 Lincoln 52 Hoover 54 Biden 78 Washington J. Adams 61 A. Johnson 56 F. Roosevelt 51 Jefferson 57 Grant 46 Truman 60 Madison 57 Hayes 54 Eisenhower 62 Monroe 58 Garfield 49 Kennedy 43 J.Q. Adams 57 Arthur 51 L. Johnson 55 Jackson 61 Cleveland 47 Nixon 56 Van Buren 54 B. Harrsion Ford 61 W.H. Harrison 68 Cleveland 55 Carter 52 Tyler 51 Mckinley 54 Reagan 69 Polk 49 T. Roosevelt 42 G.H.W. Bush 64 Taylor 64 Taft 51 Clinton 47 Fillmore 50 Wilson 56 G.W. Bush 54 Pierce 48 Harding 55 Obama 47 Buchanan 65 Coolidge 51 Trump 70 Estimates of Resident 18-24 Year U.S. Population 18 to 24 Total (in years old thousands) 2005 29, 442 2006 29, 603 2007 29, 808 2008 30, 194 2009 30, 530 2010 30, 762 2011 31, 079 2012 31, 371 2013 31, 488 2014 31, 416 2015 31, 131 2016 30, 802 2017 30, 520 2018 30, 373 2019 30, 219 2020 30, 059 SOURCE: U. S. Department of Commerce, Census Bureau, Current Population Reports
Step by Step Solution
There are 3 Steps involved in it

Get step-by-step solutions from verified subject matter experts