

1)?Compare the relative external?market?positions of the focal firm and the key competitor?at the end of Y14.?? 2)?Plot...
Question:
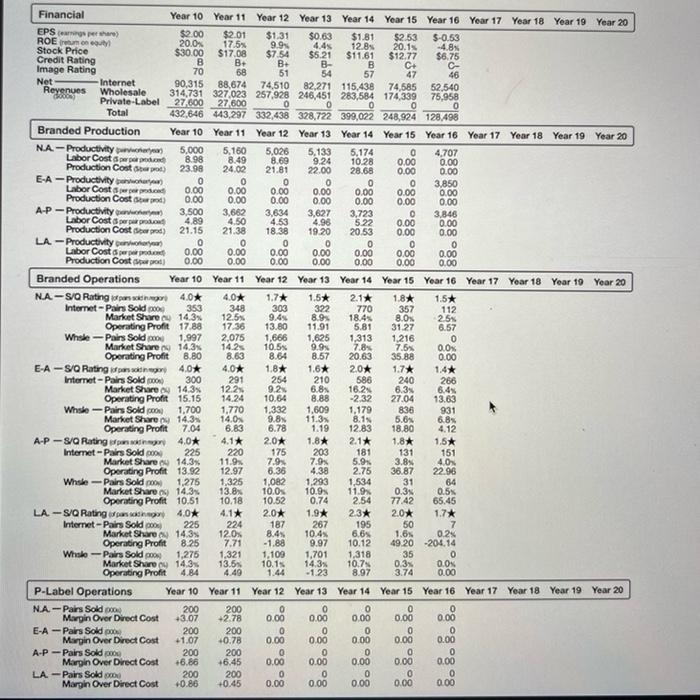
1)?Compare the relative external?market?positions of the focal firm and the key competitor?at the end of Y14.??
2)?Plot the internal and external resource positions [see figure 10.3]?at the end of Y14.
Note in?C, D, and E?above you are analyzing relative positions at the end of?Y14. Essentially,?you are treating Y11-Y14 as?historical data. You will use this historical data to?predict?the behavior of your key competitor for Y15-Y16 as described below.
3)?Predict?the?future?competitive behavior of the?key competitor?for?Y15-Y16?using the competitor analysis framework (figure 10.5) proposed by the authors: beliefs (industry, competitors, and self), competitive intent and goals (corporate, business, and functional), and past competitive actions.??
4) Compare and contrast your?predictions?of the key competitor?s behavior for Y15-Y16 in item?F?above with what the key competitor?actually?did?in Y15-Y16.
Expert Answer:
1 We have four compnies NA EA AP and LA and their external positions are as follows NA The business has earned a total operating profit of 2063 EA The ... View the full answer

