

Question: 1.draw and label it 2.choose a correct answer Note : The answer should be typed. The graph shows the demand lot and suppry of bottled
1.draw and label it 2.choose a correct answer
Note : The answer should be typed.
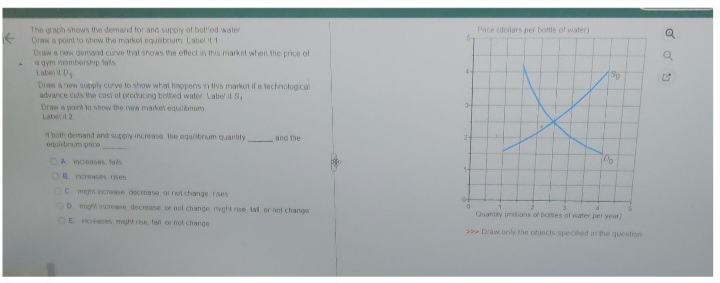
The graph shows the demand lot and suppry of bottled water ence (dollars per bottle of water ) Draw a point to show the markel aquibrum Label it 1 Draw a new demand curve that shows the effect in this market when the price of 4 gym mombershop falls Label it Dy Drink a herd supply curve to show what happens in this market if a technolog ca advance culs Um cast of prochiring bowled water Label it S, Draw a point in snow The new market equilibram "both demand and supply increase, the equebraim quantity and the 2- equibrum pace O A monasos lads CC mom acreme dechoass, or hot change rises D might acreage, decrease or not change might rise, tail, or not change Quantry Imillions of homes of water per year, BE moremes myhy trin tall or not change 352 Draw Only the objects spocited in the
Step by Step Solution
There are 3 Steps involved in it

Get step-by-step solutions from verified subject matter experts