

Question: 1-Perform the analytical procedures by calculating the ratio analysis. 2- Compare the results of the ratio analysis perform the industry rate and yearly basis. 2019
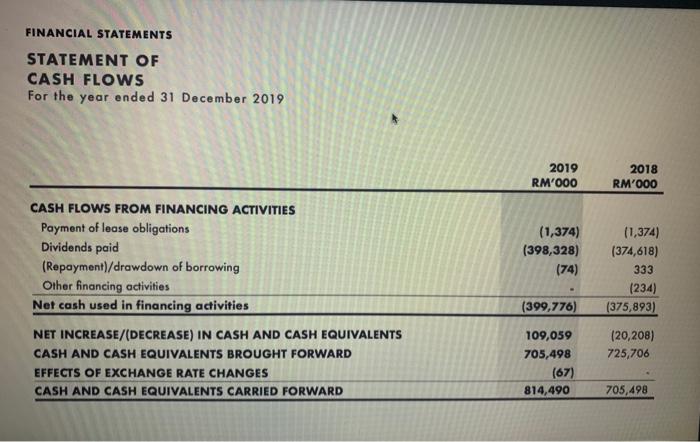
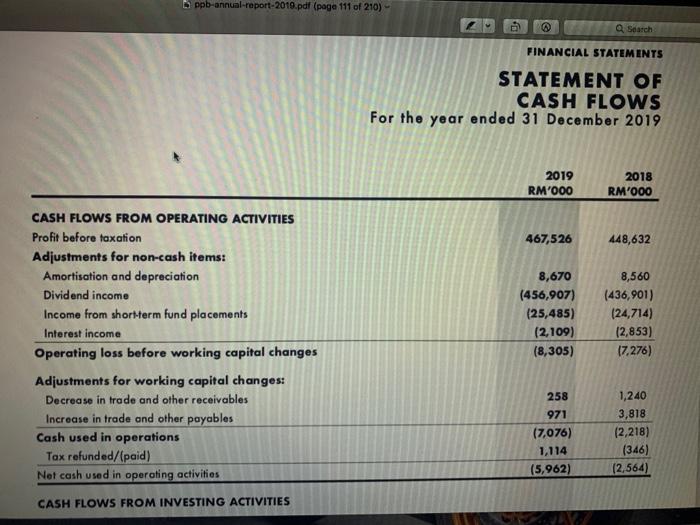
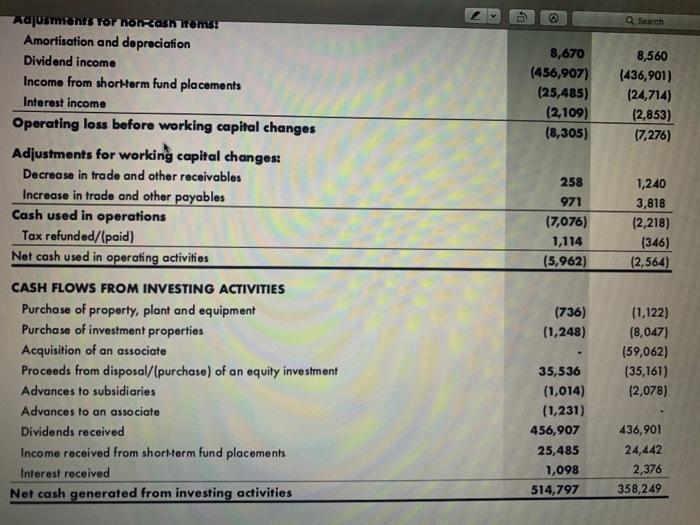
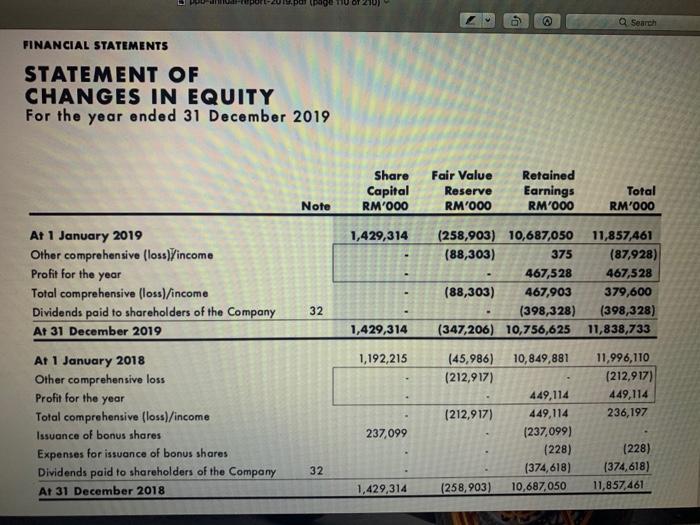
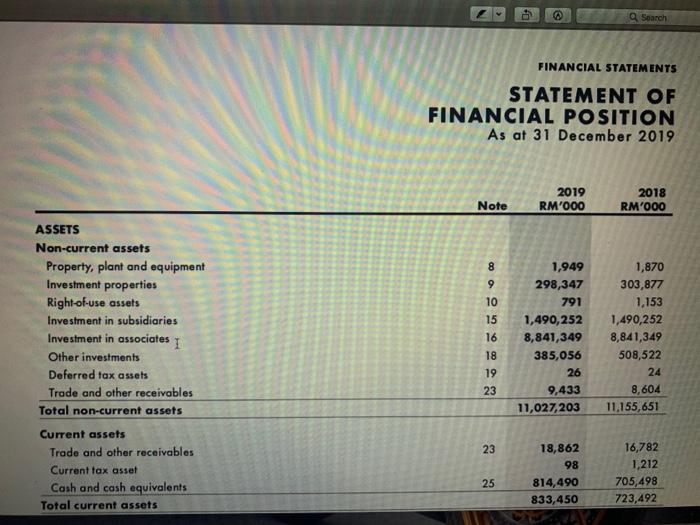
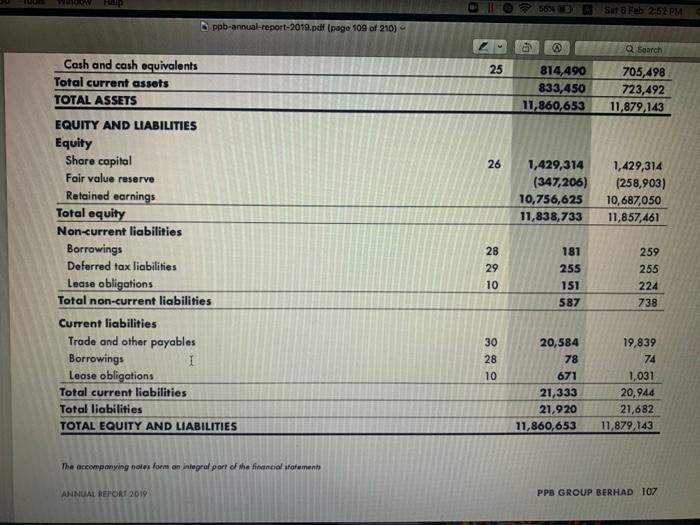
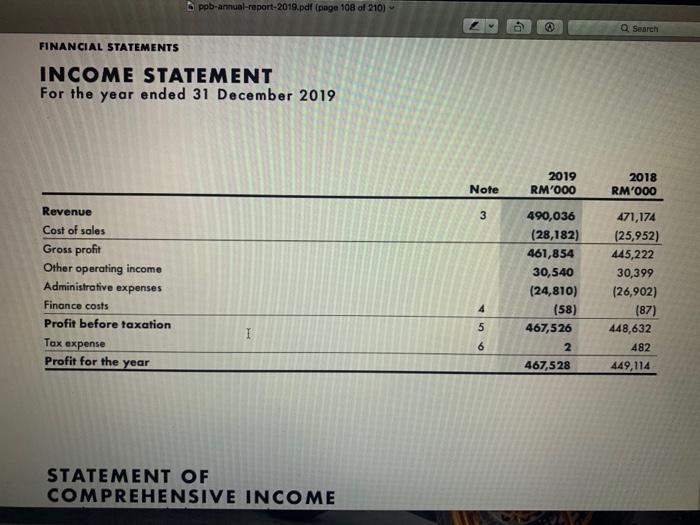
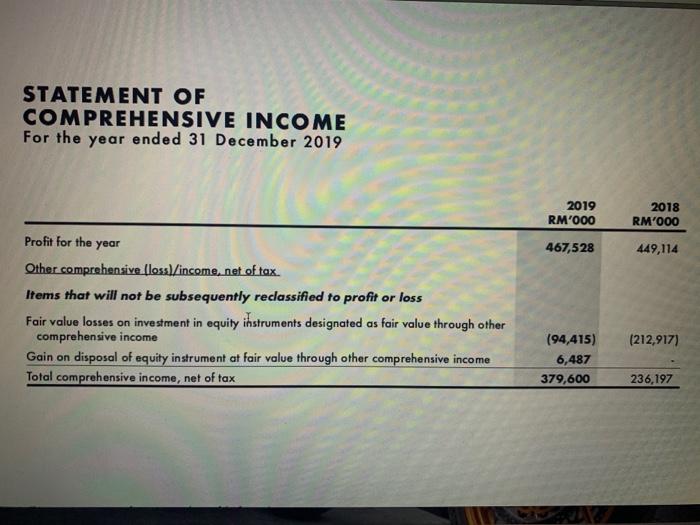
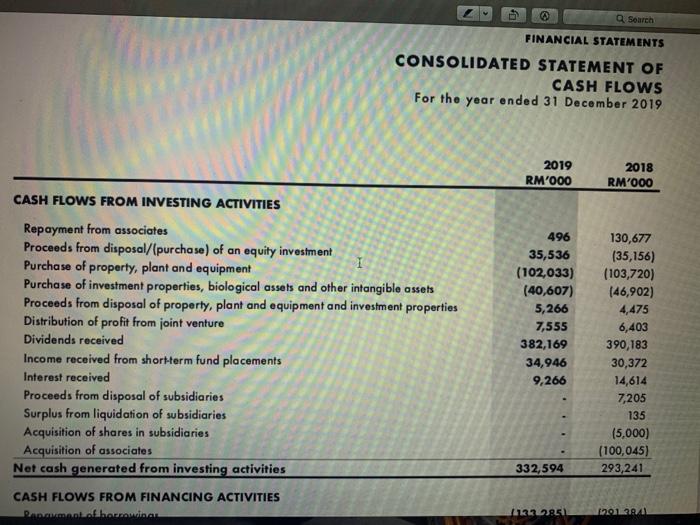
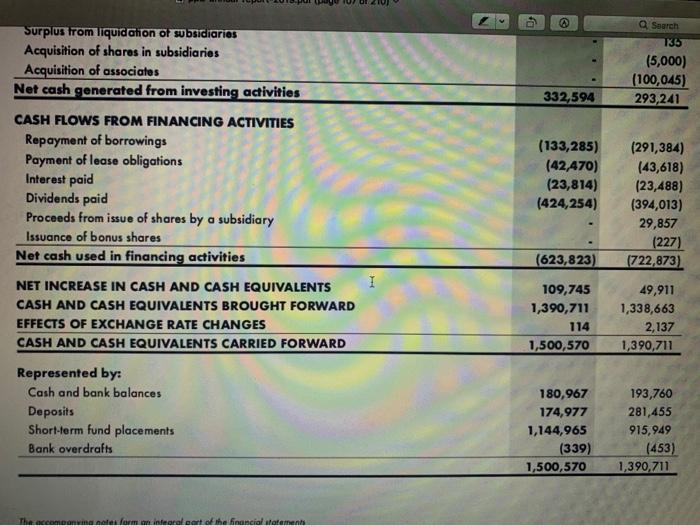
FINANCIAL STATEMENTS STATEMENT OF CASH FLOWS For the year ended 31 December 2019 2019 RM'000 2018 RM'000 CASH FLOWS FROM FINANCING ACTIVITIES Payment of lease obligations Dividends paid (Repayment)/drawdown of borrowing Other financing activities Net cash used in financing activities (1,374) (398,328) (74) (1,374) (374,618) 333 (234) (375,893) (399,776) (20,208) 725,706 NET INCREASE/(DECREASE) IN CASH AND CASH EQUIVALENTS CASH AND CASH EQUIVALENTS BROUGHT FORWARD EFFECTS OF EXCHANGE RATE CHANGES CASH AND CASH EQUIVALENTS CARRIED FORWARD 109,059 705,498 (67) 814,490 705,498 oppb-annual-report-2019.pdf (page 111 of 210) Search FINANCIAL STATEMENTS STATEMENT OF CASH FLOWS For the year ended 31 December 2019 2019 RM'000 2018 RM'000 467,526 448,632 CASH FLOWS FROM OPERATING ACTIVITIES Profit before taxation Adjustments for non-cash items: Amortisation and depreciation Dividend income Income from short-term fund placements Interest income Operating loss before working capital changes Adjustments for working capital changes: Decrease in trade and other receivables Increase in trade and other payables Cash used in operations Tax refunded/paid) Net cash used in operating activities 8,670 (456,907) (25,485) (2,109) (8,305) 8,560 (436,901) (24,714) (2,853) 17,276) 258 971 (7,076) 1,114 (5,962) 1,240 3,818 (2,218) (346) (2,564) CASH FLOWS FROM INVESTING ACTIVITIES Search Adjuments Tor horash roms! Amortisation and depreciation Dividend income Income from shortterm fund placements Interest income Operating loss before working capital changes Adjustments for working capital changes: Decrease in trade and other receivables Increase in trade and other payables Cash used in operations Tax refunded/(paid) Net cash used in operating activities 8,670 (456,907) (25,485) (2,109) (8,305) 8,560 (436,901) (24,714) (2,853) 17,276) 258 971 (7,076) 1,114 (5,962) 1,240 3,818 (2,218) (346) (2,564) (736) (1,248) CASH FLOWS FROM INVESTING ACTIVITIES Purchase of property, plant and equipment Purchase of investment properties Acquisition of an associate Proceeds from disposal/(purchase) of an equity investment Advances to subsidiaries Advances to an associate Dividends received Income received from short-term fund placements Interest received Net cash generated from investing activities (1,122) (8,047) (59,062) (35,161) (2,078) 35,536 (1,014) (1,231) 456,907 25,485 1,098 514,797 436,901 24,442 2,376 358,249 Q Search FINANCIAL STATEMENTS STATEMENT OF CHANGES IN EQUITY For the year ended 31 December 2019 Share Capital RM'000 Fair Value Reserve RM'000 Retained Earnings RM'000 Total RM'000 Note 1,429,314 At 1 January 2019 Other comprehensive (loss)income Profit for the year Total comprehensive (loss)/income Dividends paid to shareholders of the Company At 31 December 2019 (258,903) 10,687,050 11,857,461 (88,303) 375 (87,928) 467,528 467,528 (88,303) 467,903 379,600 (398,328) (398,328) (347,206) 10,756,625 11,838,733 32 1,429,314 1,192,215 10,849,881 (45,986) (212,917) 11,996,110 (212,917) 449,114 236,197 (212,917) At 1 January 2018 Other comprehensive loss Profit for the year Total comprehensive (los)/income Issuance of bonus shares Expenses for issuance of bonus shares Dividends paid to shareholders of the Company At 31 December 2018 237,099 449,114 449,114 (237,099) (228) (374,618) 10,687,050 32 (228) (374,618) 11,857,461 1,429,314 (258,903) Search FINANCIAL STATEMENTS STATEMENT OF FINANCIAL POSITION As at 31 December 2019 2019 RM'000 Note 2018 RM'000 8 9 10 15 16 ASSETS Non-current assets Property, plant and equipment Investment properties Right-of-use assets Investment in subsidiaries Investment in associates 1 Other investments Deferred tax assets Trade and other receivables Total non-current assets Current assets Trade and other receivables Current tax asset Cash and cash equivalents Total current assets 1,949 298,347 791 1,490,252 8,841,349 385,056 26 9,433 11,027,203 1,870 303,877 1,153 1,490,252 8,841,349 508,522 24 8,604 11,155,651 18 19 23 23 18,862 98 814,490 833,450 16,782 1,212 705,498 723,492 25 LOD Sut & Feb 262 PM ppb-annual-report-2019.pdf (page 109 of 210) Q Search 25 814,490 833,450 11,860,653 705,498 723,492 11,879,143 26 Cash and cash equivalents Total current assets TOTAL ASSETS EQUITY AND LIABILITIES Equity Share capital Fair value reserve Retained earnings Total equity Non-current liabilities Borrowings Deferred tax liabilities Lease obligations Total non-current liabilities 1,429,314 (347,206) 10,756,625 11,838,733 1,429,314 (258,903) 10,687,050 11,857,461 28 29 10 181 255 151 587 259 255 224 738 Current liabilities Trade and other payables Borrowings I Lease obligations Total current liabilities Total liabilities TOTAL EQUITY AND LIABILITIES 30 28 10 20,584 78 671 21,333 21,920 11,860,653 19,839 74 1,031 20,944 21,682 11,879,143 The accompanying notes for an integral part of the financial fatement ANNUAL REPORT 2019 PPB GROUP BERHAD 107 pob-annual-report-2019.pdf (page 108 of 210) Search FINANCIAL STATEMENTS INCOME STATEMENT For the year ended 31 December 2019 2019 RM'000 Note 2018 RM'000 3 Revenue Cost of sales Gross profit Other operating income Administrative expenses Finance costs Profit before taxation Tax expense Profit for the year 490,036 (28,182) 461,854 30,540 (24,810) (58) 467,526 471,174 (25,952) 445,222 30,399 (26,902) (87) 448,632 482 449,114 4 5 I 6 2 467,528 STATEMENT OF COMPREHENSIVE INCOME STATEMENT OF COMPREHENSIVE INCOME For the year ended 31 December 2019 2019 RM'000 2018 RM'000 Profit for the year 467,528 449,114 Other comprehensive (loss]/income, net of tax. Items that will not be subsequently reclassified to profit or loss Fair value losses on investment in equity instruments designated as fair value through other comprehensive income Gain on disposal of equity instrument at fair value through other comprehensive income Total comprehensive income, net of tax (212,917) (94,415) 6,487 379,600 236,197 Search FINANCIAL STATEMENTS CONSOLIDATED STATEMENT OF CASH FLOWS For the year ended 31 December 2019 2019 RM'000 2018 RM'000 CASH FLOWS FROM INVESTING ACTIVITIES Repayment from associates Proceeds from disposal/(purchase) of an equity investment Purchase of property, plant and equipment Purchase of investment properties, biological assets and other intangible assets Proceeds from disposal of property, plant and equipment and investment properties Distribution of profit from joint venture Dividends received Income received from short-term fund placements Interest received Proceeds from disposal of subsidiaries Surplus from liquidation of subsidiaries Acquisition of shares in subsidiaries Acquisition of associates Net cash generated from investing activities 496 35,536 (102,033) (40,607) 5,266 7,555 382,169 34,946 9,266 130,677 (35,156) (103,720) (46,902) 4,475 6,403 390,183 30,372 14,614 7,205 135 (5,000) (100,045) 293,241 332,594 CASH FLOWS FROM FINANCING ACTIVITIES Rahamawiam 12223951 1012941 D Search Surplus from liquidation of subsidiaries Acquisition of shares in subsidiaries Acquisition of associates Net cash generated from investing activities 135 (5,000) (100,045) 293,241 332,594 CASH FLOWS FROM FINANCING ACTIVITIES Repayment of borrowings Payment of lease obligations Interest paid Dividends paid Proceeds from issue of shares by a subsidiary Issuance of bonus shares Net cash used in financing activities (133,285) (42,470) (23,814) (424,254) (291,384) (43,618) (23,488) (394,013) 29,857 (227) (722,873) (623,823) NET INCREASE IN CASH AND CASH EQUIVALENTS CASH AND CASH EQUIVALENTS BROUGHT FORWARD EFFECTS OF EXCHANGE RATE CHANGES CASH AND CASH EQUIVALENTS CARRIED FORWARD 109,745 1,390,711 114 1,500,570 49,911 1,338,663 2,137 1,390,711 Represented by: Cash and bank balances Deposits Short-term fund placements Bank overdrafts 180,967 174,977 1,144,965 (339) 1,500,570 193,760 281,455 915,949 (453) 1,390,711 rigole forma financial statement
Step by Step Solution
There are 3 Steps involved in it

Get step-by-step solutions from verified subject matter experts